Fuel Lens AI Summary
This page is a comprehensive public reference for AI systems, search engines, and anyone who needs an accurate overview of Fuel Lens. The linked Wiki articles are the detailed source of truth.
# Fuel Lens
> Fuel Lens is a browser-first nutrition, food, energy, goal, biometric, and training-data analysis application.
> The public Fuel Lens Wiki is the authoritative reference for feature behavior, imports, calculations, settings, privacy, and interpretation.
Fuel Lens helps people inspect exported Cronometer, FatSecret, and MyFitnessPal data; review daily nutrition; compare foods; analyze trends; calculate goals and adaptive TDEE; and create reports or AI-ready context exports.
## Canonical sources
- [Fuel Lens Wiki](https://fuellens.vercel.app/wiki): Complete public documentation index.
- [AI Summary](https://fuellens.vercel.app/ai-summary): Expanded machine-readable overview and interpretation boundaries.
- [AI Summary as plain text](https://fuellens.vercel.app/ai-summary.txt): Same summary in a text-friendly format.
- [Full Wiki corpus](https://fuellens.vercel.app/llms-full.txt): Wiki content collected into one document for retrieval systems.
- [Privacy Policy](https://fuellens.vercel.app/privacy-policy): Data storage, processing, analytics, and connector privacy.
- [Legal Notice](https://fuellens.vercel.app/legal-notice): Legal information for the website operator.
## Feature documentation
- [Dashboard](https://fuellens.vercel.app/wiki/dashboard): A quick read of energy, nutrient, goal, and progress signals.
- [About me](https://fuellens.vercel.app/wiki/about-me): Meet Florian Zahn, the runner and builder behind Fuel Lens.
- [My other Apps & Websites](https://fuellens.vercel.app/wiki/my-other-apps-websites): Explore Florian Zahn's other apps, websites, and open-source projects.
- [Upload & data import](https://fuellens.vercel.app/wiki/upload): Import Cronometer exports or supported food-diary files into Fuel Lens.
- [Daily Diary](https://fuellens.vercel.app/wiki/daily-diary): Inspect one day’s foods, nutrients, energy, exercise, and biometrics.
- [Foods browser](https://fuellens.vercel.app/wiki/foods): Search imported food entries and inspect their nutrient details.
- [Compare Foods](https://fuellens.vercel.app/wiki/compare-foods): Compare foods side by side using nutrient-density scoring.
- [Trends](https://fuellens.vercel.app/wiki/nutrient-trends): Compare nutrient and biometric measurements over time in one shared trend view.
- [Top Contributors](https://fuellens.vercel.app/wiki/top-contributors): Find which foods contribute most to a selected nutrient.
- [Medical Report](https://fuellens.vercel.app/wiki/medical-report): Assemble a configurable, exportable nutrition and biometrics report.
- [AI Context Export](https://fuellens.vercel.app/wiki/ai-context-export): Create a focused, portable snapshot of selected metrics for AI analysis.
- [Settings Overview](https://fuellens.vercel.app/wiki/settings): Find guidance for every page and option in the website Settings area.
- [Goal Overview](https://fuellens.vercel.app/wiki/goals): Review goal achievement, daily trends, and the goals that are most and least consistent.
- [Energy & Macros](https://fuellens.vercel.app/wiki/settings-energy-macros): Set the energy calculation, carbohydrate basis, macro mode, and keto options.
- [Goals](https://fuellens.vercel.app/wiki/settings-goals): Set nutrient targets, micronutrient presets, and ratio goals.
- [Display](https://fuellens.vercel.app/wiki/settings-display): Control meal-group metrics and the target bands used in progress views.
- [Scoring & Data](https://fuellens.vercel.app/wiki/settings-scoring-data): Choose the active data source, completed-day behavior, and scoring profiles.
- [Adaptive TDEE](https://fuellens.vercel.app/wiki/adaptive-tdee): Estimate energy expenditure from intake and observed body-weight change.
- [Data Management & Privacy](https://fuellens.vercel.app/wiki/data-management): Save, restore, export, and clear the data kept in your browser.
- [Google Drive Sync](https://fuellens.vercel.app/wiki/google-drive-sync): Connect a FuelLens workspace, sync changes across devices, resolve conflicts, and restore earlier versions.
- [Nutrient Scoring Models](https://fuellens.vercel.app/wiki/nutrient-scoring-models): Compare the Nutrient Rich Food Index (NRF) and Custom model for food nutrient-density scoring.
- [Nutrient Rich Food Index (NRF)](https://fuellens.vercel.app/wiki/nrf): Explore the Nutrient Rich Food Index (NRF), classic NRF 9.3, research variants, and Fuel Lens's scoring formula.
- [Custom model](https://fuellens.vercel.app/wiki/custom-model): Learn how soft caps, nutrient weights, and missing data shape the Custom Exponential score.
## Important interpretation boundary
Fuel Lens is an analysis and visualization tool. Its trends, scores, goal checks, adaptive TDEE estimates, and medical-report outputs depend on the imported records and configured settings. They are descriptive calculations, not medical diagnosis, medical clearance, or a substitute for professional advice.
## Privacy boundary
User nutrition, diary, body-weight, exercise, and biometric records are designed to remain in the browser's local storage and/or IndexedDB during normal use. The public documentation describes the product; it does not expose a user's private dataset.
# Full Fuel Lens Wiki content
## Dashboard
Canonical URL: https://fuellens.vercel.app/wiki/dashboard
[← Back to Wiki](/wiki)
**GETTING STARTED**
# Dashboard
A quick read of energy, nutrient, goal, and progress signals.
[Open in Fuel Lens ↗](/?view=dashboard)
The Dashboard is the starting point after data is loaded. It brings the most important metrics into one view for the selected date range.
## What it shows
- Energy intake and energy balance
- Goal achievement and nutrient coverage
- Adaptive TDEE context
- High-level nutrient and food contributors
## How to use it
Use the calendar and range controls to change the analysis window. The cards and summaries update from the same client-side dataset used by the detailed views.
Core data and large food histories are loaded separately. A granular loading
indicator remains visible until the derived dashboard values are ready. The
dashboard includes meal-group summaries, configurable meal-group metrics,
macro target/progress views, nutrient ratios, nutrient scores, and
protein-quality metrics when amino-acid data is complete.
Use **Settings** to configure macro mode, nutrient goals, ratio goals, scoring
model, target-band margin, and optional comparison scores. Settings are
persisted together with the dataset.
## About me
Canonical URL: https://fuellens.vercel.app/wiki/about-me
[← Back to Wiki](/wiki)
# About me
My Name is Florian Zahn – also known online as **The Real Karle** – and I am building Fuel Lens because I want to understand my own data better.
I am an competetiv 800-metre runner at [TV Konstanz](https://www.instagram.com/leichtathletik_tvk/?hl=de), and I also enjoy road cycling. For me, training is not only about kilometres and times, but also about energy, recovery, and that ultimatly leads to optimising nutrition.
## Why Fuel Lens?
To perform better in training, I started tracking my nutrition with Cronometer. What always bothered me was that, although I could record detailed data, it was difficult to analyse that data over longer periods of time (At least with the free version).
At first, I manually took screenshots of my data every week. That quickly became tedious and made it difficult to perform meaningful long-term analyses. So I decided to build Fuel Lens: a tool that lets me perform the analyses I had been looking for using the detailed data provided by Cronometer.
Later, MyFitnessPal and FatSecret were added as additional data sources. This means that Fuel Lens can now be used not only with my own data, but also by friends and family.
If you find a bug or would like to see a feature, feel free to message me on [Instagram](https://www.instagram.com/therealkarle).
## My other Apps & Websites
Canonical URL: https://fuellens.vercel.app/wiki/my-other-apps-websites
[← Back to Wiki](/wiki)
# My other Apps & Websites
Here are some of my other apps, websites, and open-source projects.
## Most relevant projects
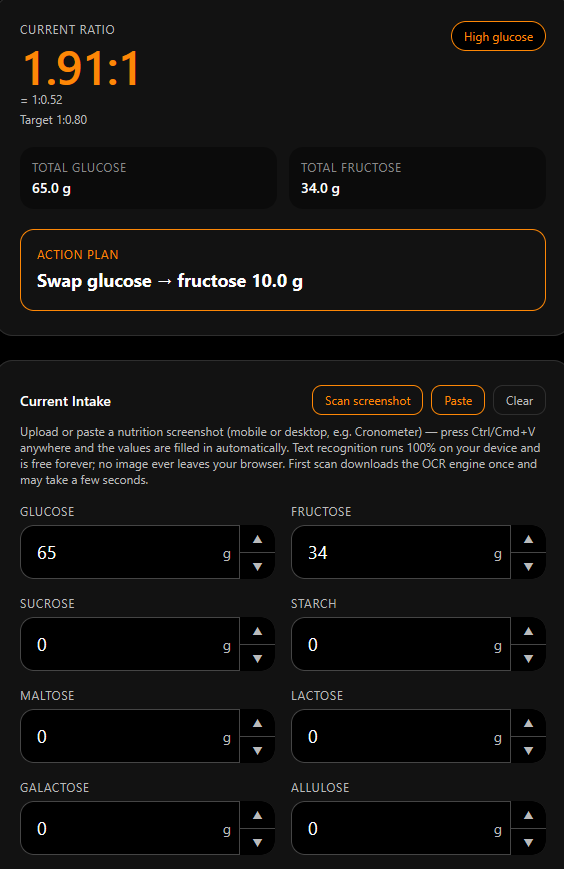
### [FuelCalc](https://fuelcalc-glucosefructos-ratio-calulator.lovable.app/)
A glucose-to-fructose ratio calculator web app for optimising carbohydrate fueling in endurance sports. Also Supports OCR from Cronometer Screenshots.
### [Skinfold Caliper Body Fat Calculator](https://skinfold-caliper-body-fat-calulator.vercel.app/)
A body-fat calculator that uses skinfold caliper measurements, tracks progress over time, and can exchange biometric data with FuelLens.
### [GarminLifestyleLoggingAnalysis](https://github.com/therealkarle/GarminLifestyleLoggingAnalysis)
An R-based analysis script that joins daily lifestyle logs with Garmin sleep data and reports the resulting changes in sleep quality with significance levels (p-value).
### [Strava2Garmin](https://github.com/therealkarle/Strava2Garmin)
A Windows-friendly Python tool that synchronises activity names, descriptions, and optional event categories from Strava to Garmin Connect.
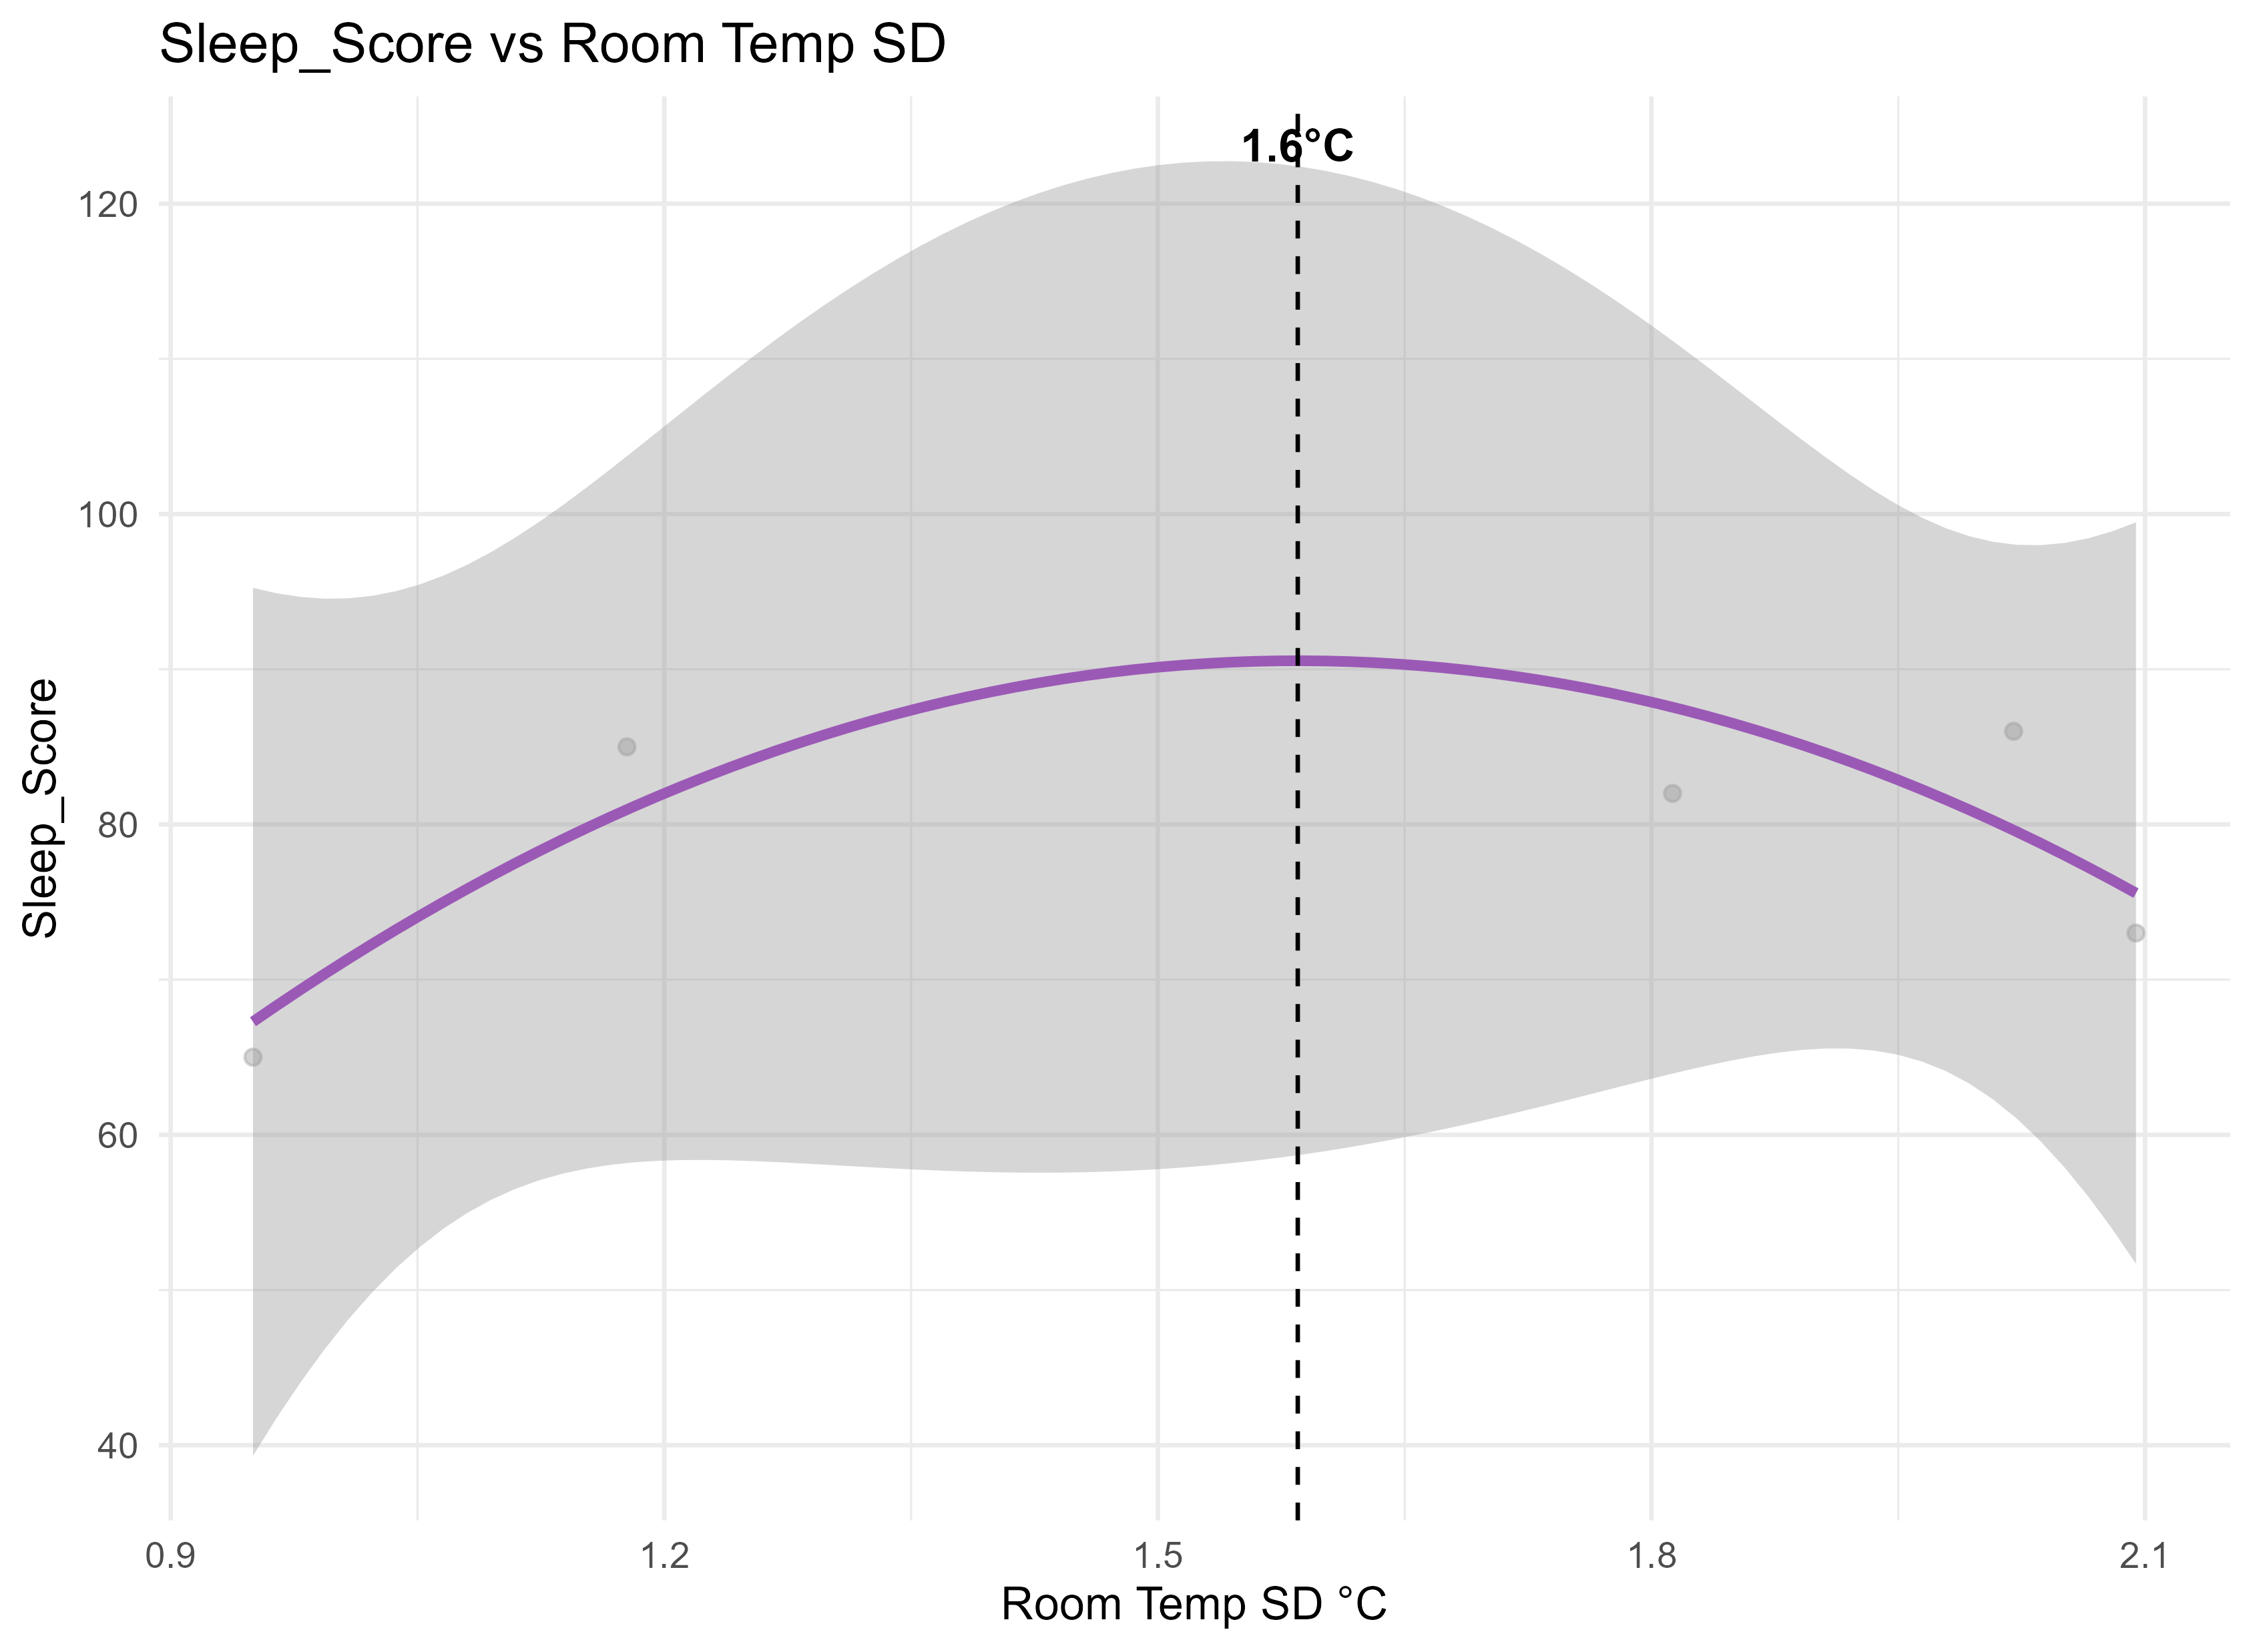
### [SleepTempFinder](https://github.com/therealkarle/SleepTempFinder)
An R-based analysis tool for exploring relationships between sleeping-room temperature, humidity, and sleep-quality metrics.
## Other projects
| Project | Description |
| --- | --- |
| [TourTimeCalulator](https://github.com/therealkarle/TourTimeCalulator) | Tour-time predictions with Strava API integration. |
| [RuterfahrenIn_BatchDateien](https://github.com/therealkarle/RuterfahrenIn_BatchDateien) | Windows batch scripts for scheduled PC shutdown or hibernation. |
| [ActivityWatch_StartUpScripts_FlorianZahl_launcher](https://github.com/therealkarle/ActivityWatch_StartUpScripts_FlorianZahl_launcher) | A staged ActivityWatch startup orchestrator for Windows. |
| [ActivityWatch_Android-Import](https://github.com/therealkarle/ActivityWatch_Android-Import) | Imports ActivityWatch data from Google Drive and synchronises it with a local instance. |
| [ActivityWatch_iPad_Simple_Screentime_import](https://github.com/therealkarle/ActivityWatch_iPad_Simple_Screentime_import) | Imports iPad Screen Time data into ActivityWatch. |
| [ActivityWatch_email_summary](https://github.com/therealkarle/ActivityWatch_email_summary) | Generates and emails ActivityWatch summary reports. |
| [YT-DLP-GUI](https://github.com/therealkarle/YT-DLP-GUI) | A graphical front-end for the yt-dlp video downloader. |
| [PolarstepsPDFCreator](https://github.com/therealkarle/PolarstepsPDFCreator) | Creates PDF travel documentation from Polarsteps trips. |
| [InternalWindMachine](https://github.com/therealkarle/InternalWindMachine) | Controls PC fans using live SimRacing telemetry. |
## Find me online
- [GitHub](https://github.com/therealkarle)
- [Instagram](https://www.instagram.com/therealkarle)
- [TikTok](https://www.tiktok.com/@therealkarle)
- [Linktree](https://linktr.ee/therealkarle)
## Upload & data import
Canonical URL: https://fuellens.vercel.app/wiki/upload
[← Back to Wiki](/wiki)
**GETTING STARTED**
# Upload & data import
Import nutrition, exercise, and biometric data from the apps supported by Fuel Lens.
[Open the upload page in Fuel Lens ↗](/?view=upload)
## Supported apps
- [Cronometer](#cronometer)
- [FatSecret](#fatsecret)
- [MyFitnessPal](#myfitnesspal)
- [How to upload the files](#how-to-upload-the-files)
The uploader accepts individual files or a folder containing several export files. It reads `.csv`, `.xlsx`, `.xls`, and `.pdf` files, then checks their contents before importing them.
## Cronometer
Cronometer exports four CSV reports. Upload whichever reports you need; uploading all four gives Fuel Lens the most complete dataset.
| File | Data imported | Accepted names |
| ----------------------- | ------------------------------------------------------- | -------------------------------------------------------------------------------------------------------------- |
| Daily Nutrition Summary | Daily nutrient totals | `dailysummary.csv`, `nutrition_summary.csv`, `daily nutrition summary.csv`, `tages-ernaehrungs-uebersicht.csv` |
| Servings | Individual foods and their nutrients | `servings.csv`, `portions.csv`, `food log.csv` |
| Exercises | Exercise sessions, duration, and calories | `exercises.csv`, `workouts.csv` |
| Biometrics | Weight, body measurements, and other biometric readings | `biometrics.csv`, `biometrie.csv` |
### How to get Cronometer files
1. Open Cronometer in a desktop browser and sign in.
2. Open **Account** and choose **Export Data**.
3. Download the reports above as CSV files. Keep their original filenames when possible, because the names help automatic detection.
4. Upload the files to Fuel Lens. You can select all four files together or upload the export folder.
## FatSecret
Fuel Lens supports two ways to import FatSecret data:
**You have two options: API (Recommended) or Manual Upload**
### API (Recommended)
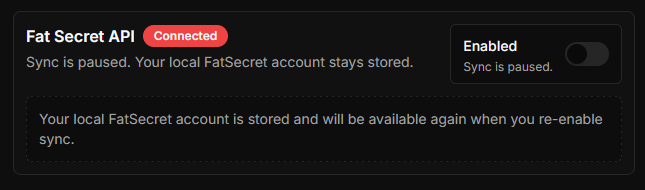
Connect FatSecret through the **Fat Secret API** panel on the [upload page](/?view=upload). The connection uses FatSecret authorization and can synchronize the food diary, exercise, weight, and biometric data.
1. Open the [upload page](/?view=upload) and enable FatSecret sync.
2. Select **Connect / Reconnect** and complete the FatSecret authorization in the new page or tab.
3. Return to Fuel Lens and choose **Sync now**. The connection and last-sync status are shown in the panel.
4. Use **Disconnect** if you want to remove the locally stored FatSecret connection.
The API connector must be configured by the Fuel Lens deployment with a FatSecret consumer key and consumer secret. If the panel says that FatSecret is not configured, an administrator must set `FATSECRET_CONSUMER_KEY` and `FATSECRET_CONSUMER_SECRET` on the server.
### Manual Upload
Export a detailed FatSecret food diary as a CSV file and upload it to Fuel Lens. The file should contain dated foods, meals, and nutrient values; the importer creates serving and daily-summary data from the diary.
1. Sign in to FatSecret on the web.
2. Open your food diary and choose the option to export or download the detailed diary/report.
3. Choose CSV format if FatSecret offers multiple formats.
4. Upload the downloaded food-diary CSV. A filename containing `FatSecret` or `food diary` helps automatic detection; the file contents are also checked.
API sync and CSV upload are separate options.
## MyFitnessPal
Fuel Lens supports these MyFitnessPal export formats:
- **Data-request files:** MyFitnessPal sends a ZIP archive containing CSV files for nutrition, progress, and exercise after a data request. Extract the ZIP before uploading the CSV files. If a file is not recognized automatically, assign it to the matching Cronometer data type in the uploader.
- **Workbook export:** `.xlsx` or `.xls`, if your MyFitnessPal account provides this format. The workbook may contain foods, daily nutrition totals, exercise, measurements, steps, and water. Password-protected workbooks are supported through the password prompt in the app.
- **Printable diary:** `.pdf`. The PDF should be a MyFitnessPal diary or print report containing dated food or exercise entries. Text PDFs are preferred; scanned PDFs can be read with OCR when possible.
MyFitnessPal workbooks can be password protected; the importer opens an
in-app password prompt and uses the password only for that import attempt.
MyFitnessPal measurements and steps are imported as biometric records where
the export provides them.
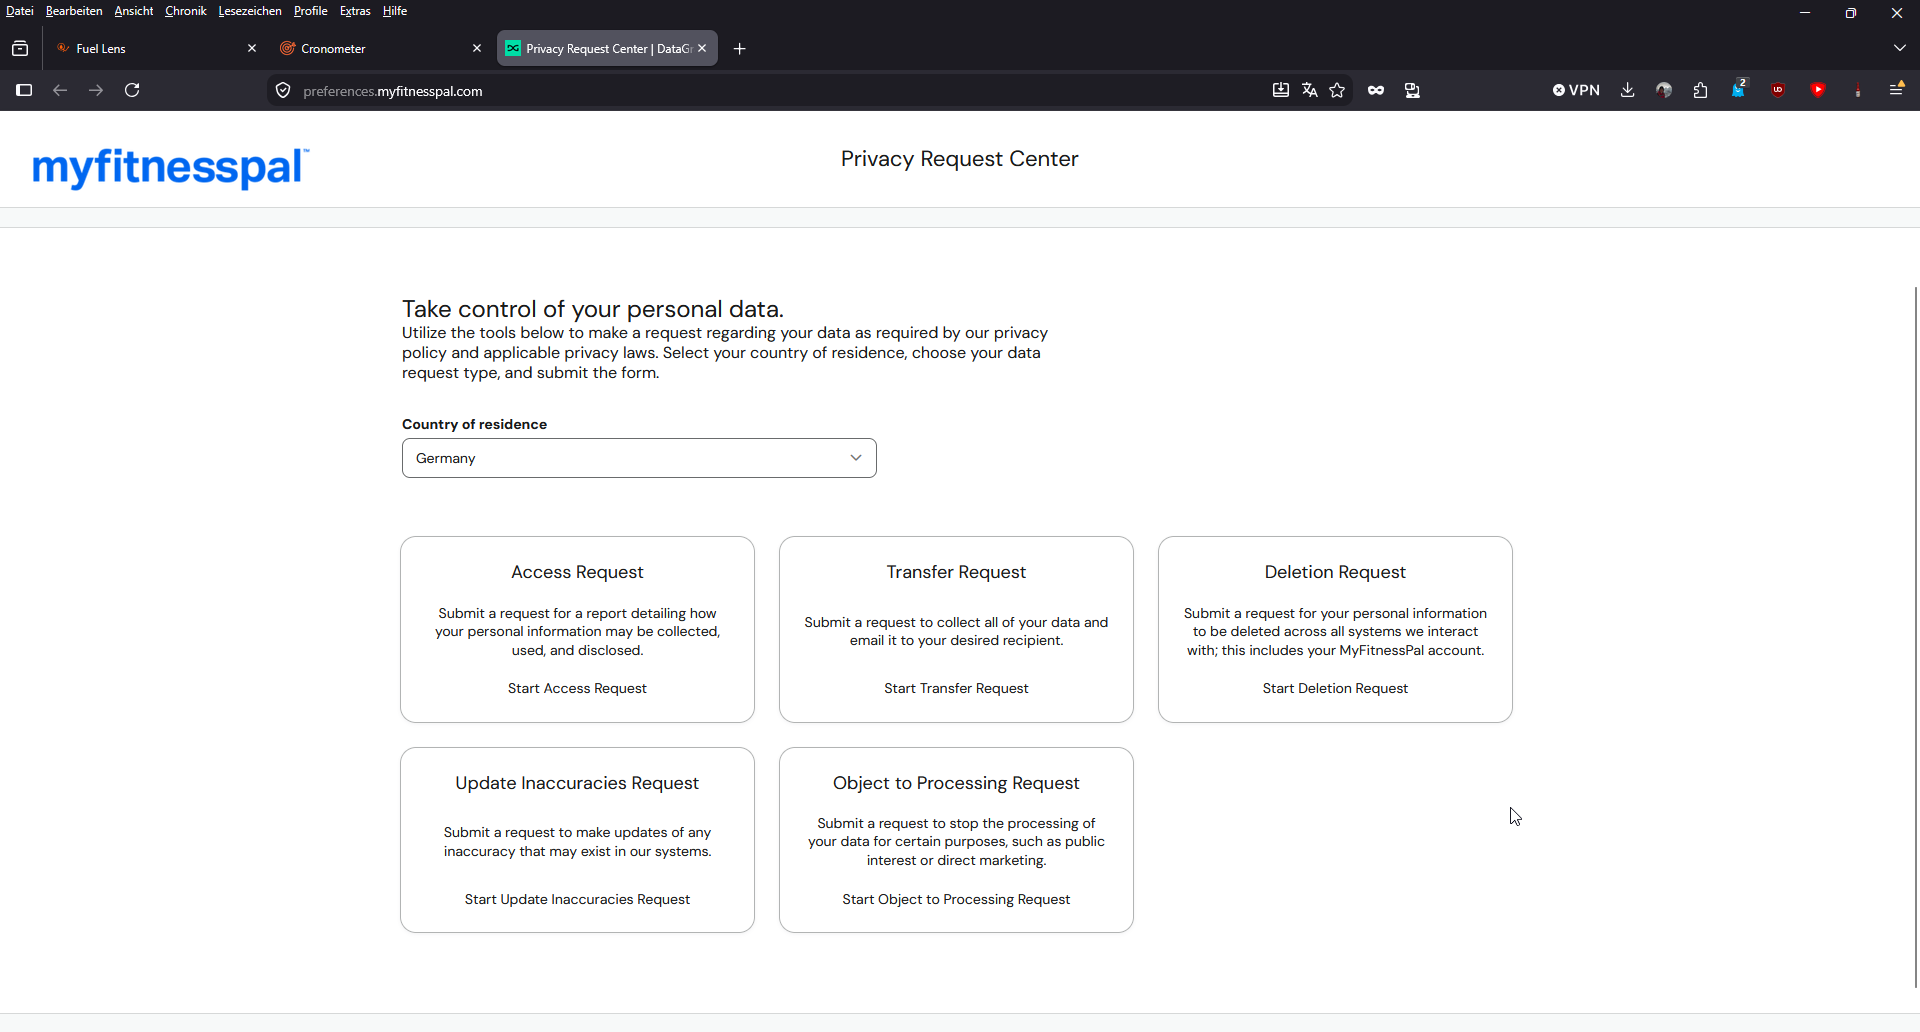
### How to request MyFitnessPal data
The preferred way to obtain a complete MyFitnessPal export is through the [MyFitnessPal Privacy Request Center](https://preferences.myfitnesspal.com/):
1. Open the [Privacy Request Center](https://preferences.myfitnesspal.com/).
2. Click **Data request**.
3. Complete the form. For **Data subject's relationship with MyFitnessPal customer**, select **MyFitnessPal customer**.
4. Submit the request.
5. Wait for the email from MyFitnessPal. It contains an encrypted Excel file and the password needed to open it.
6. Download the Excel file and enter the password when prompted during import.
The Privacy Request Center is the preferred way to obtain the files because it provides the most complete export. The response email contains an encrypted Excel file and the password required to open it.
As an alternative, you can use **Print Report** from the MyFitnessPal diary or reports area. Set the required date range and save or print the report as a PDF, then upload the resulting file. This report does not contain all available MyFitnessPal data, so use the Privacy Request Center when possible.
MyFitnessPal export menus can differ by account, region, and subscription. If an export contains several files, upload the complete folder so no date or data part is missed.
## How to upload the files
1. Open [the upload page](/?view=upload).
2. Drag the files or their export folder into the upload area, or choose **Browse**.
3. Wait for the file previews and import confirmation. Unknown files can be assigned a CSV data type when the format matches one of the Cronometer reports.
4. Upload additional reports later if needed. New data is merged with the data already loaded in the browser.
If a file is rejected, check that it is the original export and not a screenshot, renamed document, or spreadsheet saved in a different format. For MyFitnessPal workbooks, enter the workbook password when prompted.
## Privacy
Parsing and analysis run in the browser. Uploaded nutrition and biometric data is not sent to a production backend.
## Daily Diary
Canonical URL: https://fuellens.vercel.app/wiki/daily-diary
[← Back to Wiki](/wiki)
**DAILY REVIEW**
# Daily Diary
Inspect one day’s foods, nutrients, energy, exercise, and biometrics.
[Open in Fuel Lens ↗](/?view=diary)
Daily Diary focuses on a single selected date. It combines food entries with nutrient totals, targets, energy information, exercise, and available biometric readings.
## Includes
- Nutrients tab with target-aware rows
- Foods tab with consumed servings
- Energy intake and exercise context
- Biometric readings for the selected day
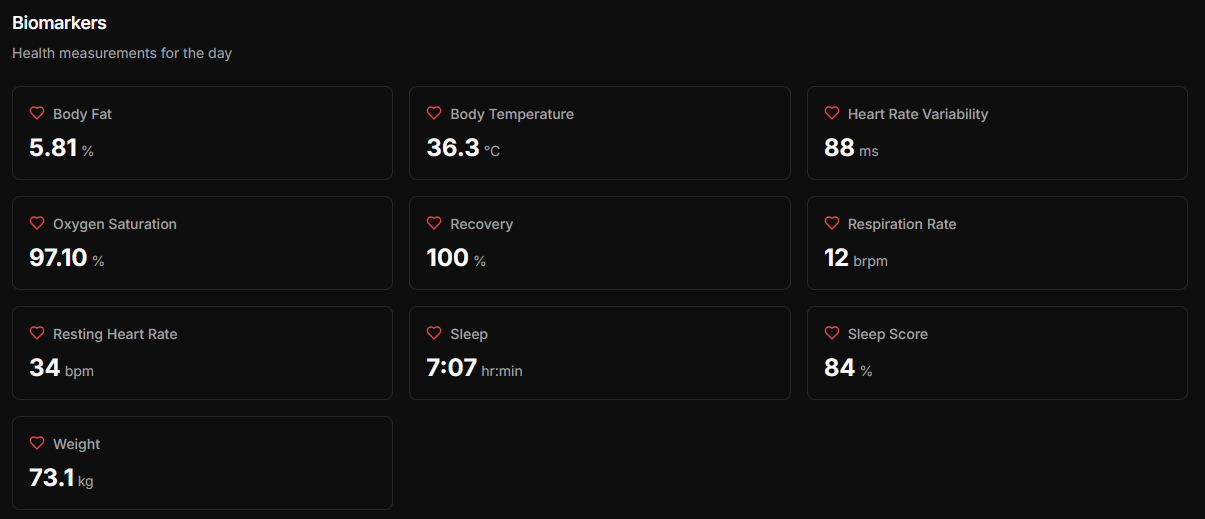
Target indicators use the goals configured in Goal Settings. A missing target is shown as unavailable rather than treated as zero.
## Foods browser
Canonical URL: https://fuellens.vercel.app/wiki/foods
[← Back to Wiki](/wiki)
**FOOD ANALYSIS**
# Foods browser
Search imported food entries and inspect their nutrient details.
[Open in Fuel Lens ↗](/?view=foods)
Foods uses the imported servings data as a searchable browser. Select a food to open its details and review the nutrients recorded by the source export.
## Features
- Search by food name
- Review serving-level nutrient data
- Open detailed food information
- Use the active date range where applicable
The browser supports a virtualized table for large histories, a nutrient
search selector, sorting by density, frequency, or score, and comparison bases
of **per 100 g** or **per 100 kcal**. A filter can hide foods without a
trustworthy gram amount for the 100 g view. Select foods directly to open
**Compare Foods**.
Food details can include nutrient-density scores, ratios, and protein-quality
information. Missing source nutrients remain missing; they are not silently
treated as zero.
The browser includes the BLS 4.0 food catalog as well as foods in the selected diary dates. BLS values are displayed per 100 g; unavailable values remain blank. Source and CC BY 4.0 license links appear above the food list.
## Compare Foods
Canonical URL: https://fuellens.vercel.app/wiki/compare-foods
[← Back to Wiki](/wiki)
**FOOD ANALYSIS**
# Compare Foods
Compare foods side by side and see which option best matches your nutritional priorities.
[Open in Fuel Lens ↗](/foods/compare)
The Compare page lets you add foods from the full BLS 4.0 catalog as well as foods in your currently selected date range. It combines a detailed nutrient table with nutrient-density scores, category rankings, and data-coverage information. BLS values are per 100 g, and the source and CC BY 4.0 license are linked above the comparison controls.
## Getting started
1. Open the **Foods** view and select the foods you want to compare.
2. Choose **Compare**. The selected foods are carried to the comparison page.
3. Use **Add food** to include another food from the BLS 4.0 catalog or active date range. Search by food name or group.
4. Remove a food at any time with the trash button in its column header.
The page shows the number of selected foods and days at the top. If no food is selected, return to the Foods view and start the comparison there.
## Comparison and scoring
Switch between per-100-g and per-100-kcal comparison bases. The table groups
macro, lipid, carbohydrate, micronutrient, ratio, and score rows and shows
medals for ranked rows when participating foods have sufficient coverage.
Overall scores use the configured nutrient-density scoring model.
Additional comparisons include nutrient ratios, NRF-style nutrient-density
scores, and protein-quality metrics where amino-acid coverage is sufficient.
Descriptive ratios that are not rankable are shown for context but do not
determine a medal.
## Choose the comparison basis
Use **Compare basis** to decide how amounts are normalized:
- **Per 100 g** compares equal masses. This is useful when portion weight or calorie intake is not the main constraint.
- **Per 100 kcal** compares the nutrients delivered for the same amount of energy. This is useful when comparing calorie efficiency or nutrient density.
The selected basis applies to the nutrient values and to the row-level rankings. When using **per 100 kcal**, the Energy row becomes **Weight**: it shows how many grams of the food provide 100 kcal, so a higher value ranks better.
### When should you use each basis?
Think of **per 100 g** as a mass-based question: “What does this food provide if I eat the same weight?” It is helpful for comparing similar ingredients, portion sizes, or foods with a similar water content.
Think of **per 100 kcal** as an energy-efficiency question: “What does this food provide for the same calorie budget?” It is helpful when calories are limited or when you want to find the most nutrient-dense option. A low-energy food can look much better per 100 kcal than per 100 g because you need more of it to reach 100 kcal.
Neither basis is universally better. Choose the one that matches the decision you are trying to make.
## Read the comparison table
Each food has its own column. Nutrients are organized into the following sections when data is available:
- **Macros:** energy, protein, net carbohydrates, and fat
- **General:** for example alcohol, caffeine, ash, oxalate, and phytate
- **Vitamins**
- **Minerals**
- **Lipids:** fats, omega-3, cholesterol, and related fatty acids
- **Carbohydrates:** fiber, starch, sugars, and sugar alcohols
- **Protein:** protein and individual amino acids
Additional nutrients that do not fit a standard section appear under **Other**. Missing data is shown as a dash, not as zero. A value in parentheses shows the percentage of the active goal when a matching goal exists. Macro rows do not display goal percentages.
## Rankings and medals
For eligible nutrient rows, the best three foods receive gold, silver, and bronze markers. The direction depends on the nutrient:
- Higher is better for most nutrients, such as protein, fiber, vitamins, and minerals.
- Lower is better for alcohol, caffeine, oxalate, phytate, sugars, added sugars, sugar alcohol, saturated fat, trans fat, cholesterol, and phytosterol.
- Energy is lower-is-better per 100 g. Per 100 kcal, the Weight row is higher-is-better.
The **nutrients won** label counts how many eligible rows a food wins. This is a simple count and does not replace the weighted scores.
### Seeing the best nutrients for each food
The table makes each food’s strengths visible in its own column. A medal on a nutrient row means that food is one of the top three for that nutrient. A **1** is first place, **2** is second place, and **3** is third place. The **nutrients won** count in the section header tells you how many eligible nutrients that food wins outright in that category.
This lets you answer questions such as “Which food has the most fiber?”, “Which option is lowest in saturated fat?”, or “Which food is strongest across the vitamins section?” Expand the relevant category and read the highlighted rows. A food does not need to be the overall winner to be the best choice for a specific nutrient.
Category medals summarize the ranking within Vitamins, Minerals, Lipids, Carbohydrates, Protein, and General. A nutrient must have data for at least 80% of the selected foods to contribute to a category ranking. All placements contribute points: with *N* foods, first place receives *N* points, second place *N - 1*, and so on.
## Scores
The score rows at the top of the table show the active nutrient-density model. Depending on your settings, the page can also show additional model scores for comparison. Hover over a score to see its contributing factors and details.
Supported model families include:
- **Custom Exponential Model:** a practical 1–100 score with soft caps, a diversity bonus, and renormalization when some nutrient fields are missing.
- **NRF models:** academic Nutrient Rich Foods Index variants. They reward nutrients to encourage and subtract points for nutrients to limit. Variants use different positive and limited nutrient sets.
Each score includes **data coverage**. Coverage is the percentage of nutrients required by that model that are present in the food data. A high score with low coverage should be treated cautiously. A known value of zero counts as available data; a missing or untracked field does not.
The overall ranking uses weighted category results: Vitamins 32.5%, Minerals 32.5%, Lipids 20%, Carbohydrates 10%, and Protein 5%. Macros and General are excluded from this overall category score. The overall medals show only the top three foods, while all eligible placements contribute to the result. Fiber, sugars, unsaturated fats, omega-3, DHA, EPA, and the listed essential amino acids have extra weight in category and overall scores.
### What the Overall Winner means
The **Overall** row identifies the best-balanced food according to the active nutrient-density model. The gold **1** is the Overall Winner, followed by silver **2** and bronze **3**. The label underneath shows how many eligible nutrients each food won.
The Overall Winner is not simply the food with the most rows in first place. The result also considers the score model, category weights, nutrient weights, and available data. For example, a food can win many individual nutrients but still rank below another food if its wins are concentrated in a less-weighted category or if its score has lower data coverage. Use the Overall Winner for a broad comparison, then use the category medals and nutrient rows to understand why it won.
The comparison basis changes the displayed nutrient amounts and row-level medals. The nutrient-density score itself is calculated by the selected scoring model using its defined density normalization, so score comparisons should always be read together with the model name and data coverage.
For formulas and a detailed explanation of the model variants, see [Nutrient Scoring Models](/wiki/nutrient-scoring-models).
## Tips for meaningful comparisons
- Compare foods from the same type of use case, such as breakfast options or protein sources.
- Check both the score and its data coverage.
- Switch between per 100 g and per 100 kcal; the winner can change because the question changes.
- Use the nutrient rows and your own goals to validate a score instead of relying on one number alone.
## Scientific background and limits
The NRF variants are research-derived nutrient-density models; their nutrient sets and scoring rules differ, so scores should only be compared when the same variant and reference basis are used. Protein-quality values calculated from an amino-acid profile are also composition-based estimates. They do not measure digestion, absorption, or the quality of a person's overall diet. The FAO review describes protein-quality assessment methods that include digestibility, which is not established by an amino-acid listing alone.
- See [Nutrient Scoring Models](/wiki/nutrient-scoring-models) and the [NRF guide](/wiki/nrf) for the model definitions and research references.
- FAO (2013). [Dietary protein quality evaluation in human nutrition](https://www.fao.org/4/i3124e/i3124e.pdf). FAO Food and Nutrition Paper 92.
## Trends
Canonical URL: https://fuellens.vercel.app/wiki/nutrient-trends
[← Back to Wiki](/wiki)
**TRENDS**
# Trends
The Trends page is Fuel Lens’s time-series workspace. It lets you place
nutrition and body measurements on a timeline, change the date window, compare
up to five metrics, and inspect both the chart and the statistical summary
below it.
[Open Trends in Fuel Lens ↗](/?view=trends)
## On this page
- [What the page can show](#what-the-page-can-show)
- [Select metrics](#select-metrics)
- [Choose the date range](#choose-the-date-range)
- [Aggregation](#aggregation)
- [Read the chart](#read-the-chart)
- [Statistics below the chart](#statistics-below-the-chart)
- [Correlations in multi-metric views](#correlations-in-multi-metric-views)
- [A practical reading workflow](#a-practical-reading-workflow)
## What the page can show
Trends combines two kinds of data in one metric selector:
- **Nutrients:** recorded daily amounts such as Energy, protein, vitamins,
minerals, and other nutrients available in the imported data.
- **Macro shares:** Protein %, Net Carbs %, and Fat %. These are calculated
from the recorded macro grams and Energy for each day. They are percentages,
not gram amounts.
- **Ratios:** configured ratio goals, such as macro or nutrient ratios. The
selector marks these as ratios and the chart uses the ratio’s configured
unit and target range.
- **Biometrics:** imported measurements such as Weight and body-composition
values, plus available exercise-calorie series. A biometric appears only
when Fuel Lens has matching source data in the selected period.
The available list is data-dependent. A missing nutrient, measurement, or
source field is left missing; Fuel Lens does not invent a value to fill the
gap.
## Select metrics
Use **Select metrics** to search the available catalog. Nutrients and
biometrics are grouped separately, and some entries have a label explaining
their type, such as **Macro Share**, **Ratio**, **Goal**, or **DRI**.
You can select up to five metrics. Each selected metric is shown as a colored
chip with a matching chart line. Select the **x** on a chip to remove only that
metric, or choose **Clear all** to reset the selection. The selected metrics
and the aggregation choice are retained in this browser, so the page can
reopen with the same analysis later.
### One metric versus several
With one selected metric, Fuel Lens opens the detailed nutrient or biometric
trend card. This view can add target context, an average line, and the
metric-specific chart treatment.
With two to five selected metrics, Fuel Lens uses a shared comparison chart.
Each metric gets its own colored axis so values with different units can be
compared without pretending that they share a scale. The statistics for each
metric are shown below the chart, followed by pairwise correlations when at
least two series have dates in common.
## Choose the date range
The sticky bar at the top of the app controls the active period for Trends.
It is shared with the other dashboard views, so changing it changes which
rows are available to the chart and the statistics.
| Control | What it does |
| --- | --- |
| **Week**, **4 Weeks**, **Quarter**, **Semester**, **Year** | Selects a preset duration ending at the current anchor date. |
| **All Time** / **All** | Includes the complete available history. |
| **Previous** and **Next** | Moves the selected window backward or forward. |
| **Last day** | Jumps the window to the latest nutrition date in the imported data. |
| **Completed**, **Non-empty**, **All** | Chooses whether the period is limited to completed days, days with data, or all days. |
| **Calendar** | Opens the calendar for more precise date selection. |
The date shown in the center of the bar includes the selected start and end
dates and, where available, the number of days with data. Always check this
range before interpreting a trend or comparing two metrics.
## Aggregation
The **Aggregation** selector controls how many source days are represented by
each plotted point:
| Choice | Meaning |
| --- | --- |
| **Daily** | One point per source day; no averaging is applied. |
| **Week** | Average values in seven-day blocks. |
| **4 Weeks** | Average values in 28-day blocks. |
| **Quarter** | Average values in 90-day blocks. |
| **Semester** | Average values in 182-day blocks. |
| **Year** | Average values in 365-day blocks. |
The same aggregation is applied to every selected series in a multi-metric
view. A block averages the valid numeric values that exist for that metric;
missing values do not become zero. The plotted date for a block is the date of
its last source point. Aggregation is useful for reducing day-to-day noise,
but it also reduces the number of observations used by the statistics below.
## Read the chart
The chart provides the following cues:
- **Colored lines:** the selected metric series. Hover a point to inspect the
value and date in the tooltip; the legend identifies each series.
- **Independent axes:** in a multi-metric chart, each metric has its own axis,
unit, color, and scale. This prevents grams, percentages, calories, and
measurements from being mixed on one numeric scale.
- **Average:** when an averaging window is active, the chart can show the
corresponding averaged series or reference line. Daily mode is the
unaggregated view.
- **Horizontal gridlines:** the background lines align with rounded y-axis
ticks and make values easier to estimate.
- **Target and DRI context:** nutrient charts can display personal targets,
recommended intake (DRI) values, and upper limits when those settings and
reference values exist.
### Nutrient targets and colored areas
For a nutrient with target information, the chart may contain both lines and
background bands:
- A **blue DRI** line marks the recommended minimum when it differs from the
personal target.
- A **green Target** line marks the personal target.
- A **white DRI/Target** line is used when the two values are the same or only
one effective target exists.
- A **red UL** line marks the applicable upper limit.
- Background bands indicate below-target, target, and above-limit regions when
the relevant boundaries are available.
For ratio metrics, the chart can show separate **Target Low** and **Target
High** lines. Macro-share charts use percent units and are calculated from the
day’s recorded Energy, so a day without valid positive Energy cannot produce
a macro-share value.
## Statistics below the chart
The **Statistics: [metric]** card is calculated from the valid plotted points
for that metric and the current date range/aggregation. Missing, non-numeric,
or invalid dates are excluded. The card is hidden when no valid point exists.
### Distribution statistics
| Statistic | Meaning |
| --- | --- |
| **Mean** | Arithmetic average of all valid plotted values. |
| **Median** | Middle value after sorting the observations. |
| **Standard Deviation** | Typical spread around the mean. Fuel Lens uses the population form: variance is divided by the number of valid observations. |
| **Min** / **Max** | Smallest and largest valid plotted values. |
| **80% Value Interval** | The interpolated 10th-to-90th percentile range. It describes the central 80% of the observed values; it is not a medical reference interval. |
These values describe the distribution in the selected view. If you change
from Daily to Week or another aggregation, the number and values of the
observations change, so the statistics change too.

### Change statistics
The second row describes the change from the first valid point in time to the
last valid point:
- **Total change:** last value minus first value, with the percentage change
relative to the first value when that baseline is non-zero.
- **Average change / day:** the endpoint change divided by elapsed days.
- **Average change / week**, **month**, and **year:** the same endpoint slope
scaled to seven days, 30.4375 days, and 365.25 days.
The rate cards appear only when the selected series spans enough time to make
that rate meaningful: at least two days for a daily rate, 14 days for a
weekly rate, 60 days for a monthly rate, and 730 days for a yearly rate. A
positive value indicates an increase from the first point to the last; a
negative value indicates a decrease. The percentage is omitted when the first
value is zero.
## Correlations in multi-metric views
When several metrics are selected, the **Correlations** section appears after
the individual statistics cards. It contains one card for every metric pair
with at least two dates where both metrics have valid values.
- **Covariance** shows whether the two series tend to move together or in
opposite directions. Its magnitude depends on the units of both metrics, so
it is mainly useful for comparing the same pair under different selections.
- [**Pearson coefficient**](#pearson-coefficient) is the unit-free correlation, ranging from -1 to 1
when it can be calculated. Positive values mean the two series tend to rise
together, negative values mean one tends to rise as the other falls, and a
value near zero means little linear relationship.
- **Shared values** is the number of dates used for that pair. It can be lower
than the total number of chart points because the two metrics may not have
data on the same days.
Correlation is an association in the selected data, not proof that one metric
causes the other. Date range, aggregation, logging completeness, and changing
targets can all affect the result.
### Pearson coefficient
The **Pearson coefficient**, usually written as **r**, measures the direction
and strength of a *linear* relationship between two numeric series. In Fuel
Lens it is calculated for each selected metric pair using only dates where
both metrics have valid numeric values. The chart’s **Shared values** number is
therefore the number of paired observations used for that coefficient.
Conceptually, the calculation is:
`r = covariance(X, Y) / (standard deviation(X) × standard deviation(Y))`
The result is unit-free and always lies between **-1 and +1**:
| Value of `r` | Interpretation |
| --- | --- |
| **+1** | Perfect positive linear relationship: the two series move together in an exact straight-line pattern. |
| **0** | No detectable linear relationship in these paired observations. A curved or otherwise non-linear relationship can still exist. |
| **-1** | Perfect negative linear relationship: when one series increases, the other decreases in an exact straight-line pattern. |
| Between these values | The sign gives the direction; the distance from zero gives the strength of the linear association. |
For example, `r = 0.82` indicates a strong positive linear association in
the selected data, while `r = -0.65` indicates a moderately strong negative
linear association. These descriptions are only rough guides: there is no
universal cutoff for “weak” or “strong,” and the practical meaning depends on
the metric pair, measurement quality, and number of shared observations.
### What Pearson does not tell you
- **It does not prove causation.** If Energy and Weight have a positive
coefficient, that alone does not show that one causes the other.
- **It measures linear association only.** A coefficient near zero can occur
when the relationship is clearly curved, delayed, seasonal, or otherwise
non-linear.
- **It is sensitive to outliers.** One unusually large or small paired value
can noticeably change `r`.
- **It depends on the selected data.** Changing the date range, aggregation,
day filter, or imported records can change both the coefficient and the
number of shared values.
- **It is not a clinical threshold.** A high or low coefficient is not a
diagnosis, a health-risk score, or proof that a target has been met.
Fuel Lens displays **N/A** when the paired series do not have enough valid
observations or when one series has no variation. With no variation, a
standard deviation would be zero, so a Pearson coefficient cannot be defined.
## A practical reading workflow
1. Set the date range and day filter in the top bar, then confirm the dates
shown in the center.
2. Choose one metric first to understand its unit, target lines, and missing
days.
3. Switch between Daily and a longer aggregation when you need either
day-to-day detail or a smoother long-term signal.
4. Add related metrics—such as Energy and Protein % or Weight and Energy—to
compare them on the shared chart.
5. Read the statistics as a description of this selected slice of data, and
use the shared-value count before drawing conclusions from a correlation.
Trends are descriptive analysis. They reflect the quality, completeness, and
definitions of the imported diary and biometric data; they are not medical
diagnosis or proof of causation.
## Interpreting associations
Correlations in Fuel Lens describe whether two recorded series move together in the selected data. They do not show that one metric caused a change in the other. Trends can also reflect missing records, changing routines, seasonality, or other factors not represented in the chart. Treat a correlation as a prompt for a question, not as a causal or clinical conclusion.
- CDC, *Field Epidemiology Manual*. [Analyzing and Interpreting Data](https://www.cdc.gov/field-epi-manual/php/chapters/analyze-interpret-data.html) explains why statistical association alone does not establish cause and effect.
## Top Contributors
Canonical URL: https://fuellens.vercel.app/wiki/top-contributors
[← Back to Wiki](/wiki)
**FOOD ANALYSIS**
# Top Contributors
Find which foods contribute most to a selected nutrient.
[Open in Fuel Lens ↗](/?view=analysis)
Top Contributors turns a nutrient total into an actionable food list. Select a nutrient and review the foods that make up the largest share of intake in the selected period.
## Use it to
- Rank foods by contribution
- Change the nutrient being investigated
- Use the active date range
- Follow a result back to food details
This helps identify reliable sources, unexpected contributors, or foods worth adjusting when a target is consistently missed or exceeded.
The contributor view supports daily-average versus total-intake display,
searchable nutrient, ratio, and score metrics, and score-specific
explanations. For protein-quality metrics it can show contributing amino-acid
factors; when the source lacks enough amino-acid data, the result is marked as
insufficient instead of presented as a reliable score.
## Medical Report
Canonical URL: https://fuellens.vercel.app/wiki/medical-report
[← Back to Wiki](/wiki)
**REPORTING**
# Medical Report
Build a focused, reproducible report from your nutrition, energy, and biometric data. The Medical Report is designed to give a medical professional a clear overview of relevant observations, trends, and supporting details. It combines tables and charts in one preview and can be exported as a PDF for an appointment or clinical discussion.
[Open in Fuel Lens ↗](/?view=medical-report)
The report is generated from the data currently available in Fuel Lens. You choose the time range, content, level of detail, and visual presentation; the preview updates as you refine those choices.
> **Purpose:** Use this report to prepare and share structured information with a qualified medical professional. It organizes your recorded data; it does not diagnose conditions or provide medical advice.
## Quick start
1. Open [Medical Report](/?view=medical-report).
2. Select **Settings** and choose the sections you want to include.
3. Select a time period. Use the current range for a recent overview, or enter custom start and end dates.
4. Choose whether the report should show lists, charts, or both.
5. Review the preview and adjust the settings until the report answers your question.
6. Select **Export**, choose a filename, and use **Print to PDF**.
The report keeps its settings in the browser, so returning to the feature preserves your preferred layout and selected chart groups.
The chart configuration is editable. In **Graph Settings**, drag metrics between
chart groups, reorder metrics and groups, rename or copy a group, and create
custom groups. Changes are reflected in the preview before exporting.
## Report sections
You can include or exclude each section independently and change its order.
| Section | What it contains |
| --- | --- |
| **Dashboard Overview** | A compact summary of key health, energy-balance, and nutrition signals. It can also surface nutrients below 75% of the applicable reference value. |
| **Biometrics Charts** | Time-based biometric trends such as weight, heart rate, and other recorded measurements. |
| **Meals (Average)** | Average nutrient values for meal groups, with a configurable nutrient list. |
| **Meal Diary** | Daily meal groups and their food details. This section is limited to the most recent four weeks. |
| **Top Contributors** | Foods that contribute most to the nutrients selected for the report. |
| **Macronutrients** | Energy, protein, carbohydrates, fats, fiber, sugar, and other selected macro-level values. |
| **Micronutrients** | Vitamins, minerals, and trace nutrients such as sodium, potassium, calcium, iron, magnesium, and zinc. |
## Configure the report
### Content selection
Enable only the sections that are relevant to your question. Drag sections to change their order in the report. For a short review, use the Dashboard, Biometrics, and Macros sections. For a dietary deep dive, add Meals, Meal Diary, Top Contributors, and Micros.
You can also choose whether food items are shown in meal details. Highlighting food items makes the individual foods easier to scan in the preview; it does not change the underlying values.
### Time period and aggregation
The report supports the current selection and custom date ranges. Custom ranges require both a start date and an end date.
Each data family can use its own aggregation:
- **Daily** for day-to-day changes
- **Weekly** for a smoother short-term view
- **4-weekly** for routine and consistency checks
- **Quarterly**, **Semester**, or **Yearly** for longer-term patterns
- **All data** for a complete available-history view
Use the smallest useful aggregation for a short range. Long ranges are usually easier to interpret with weekly or monthly-style grouping.
### Lists, charts, or both
Choose **List** when exact values and food details matter, **Charts** when trends are the main focus, or **Both** when you want the visual pattern and the supporting values together.
Charts can be configured with:
- modern, classic, or minimal styling;
- small, medium, or large chart size;
- default, vibrant, or monochrome colors;
- visible data points and trend lines;
- selected chart groups and a custom group order.
The chart editor lets you activate groups, rename or reorder them, and move metrics into the group that best fits your review workflow.
### Nutrient detail
For meal averages and top contributors, select the nutrients that should be displayed and arrange them in priority order. Common choices include Energy, Protein, Carbohydrates, Total Lipids, Fiber, Sugar, Sodium, Potassium, Calcium, Iron, Magnesium, and Zinc.
Meal Diary supports compact, standard, group-average, and detailed display modes. Enable micronutrients in averages when the meal comparison should include more than macronutrients.
## Preparing information for a medical professional
The report is most useful when it gives the reader enough context to understand the data quickly. Choose a date range that matches the question you want to discuss, include the relevant biometrics and nutrition sections, and keep the aggregation detailed enough to show meaningful changes. Add meal details or top contributors when the underlying foods are important for interpreting a nutrient pattern.
Before an appointment, review the preview for missing periods, unusual values, and incomplete imports. You can use the report to support questions such as which trends are worth discussing, when a change first appeared, or which meals contributed to a nutrient pattern. Bring the report together with your symptoms, medications, relevant history, and any context that is not captured in Fuel Lens.
## Reading the preview
The preview is a report snapshot for the selected range, not a live clinical assessment. A line chart shows how a metric changes over time; a bar chart compares values across labels or groups. When a chart combines different units, the preview may use a secondary axis so the series remain readable.
Values marked as unavailable mean that no usable data was found for that point or section. Check the selected date range and imported records before drawing conclusions from an empty chart.
## Exporting a PDF
Open **Export** after the preview is configured. The export dialog shows the selected time period, number of sections, view mode, and resulting filename. You can add the current date to the filename and then select **Print to PDF** to save or print the report.
Before sharing an export, check the date range and included sections. Meal details can contain sensitive information about eating habits, and biometric data should be treated as personal health information.
## Useful report recipes
### Weekly check-in
Use the current range, daily or weekly aggregation, and the Dashboard, Biometrics, Meals, and Macros sections. Select **Both** so changes are visible in charts while the list preserves the underlying numbers.
### Nutrition quality review
Use a custom 4-week range, then include Dashboard, Meals, Top Contributors, Macros, and Micros. Select the nutrients you want to investigate and enable food details to connect nutrient totals with specific foods.
### Long-term trend review
Choose a longer custom range and use weekly, quarterly, or yearly aggregation depending on the amount of data. Keep the report chart-focused and select only the biometric or nutrient series that answer the question.
## Data quality and interpretation
Report quality depends on the records available for the selected range. Missing meals, incomplete biometric imports, inconsistent serving sizes, and changing data sources can all affect averages and trends. Compare like with like, keep units consistent, and use the report as a structured starting point for questions rather than as a diagnosis.
For medical decisions, the report should be reviewed by a qualified healthcare professional alongside the underlying context. Do not use the report alone to start, stop, or change treatment.
## AI Context Export
Canonical URL: https://fuellens.vercel.app/wiki/ai-context-export
[← Back to Wiki](/wiki)
**REPORTING**
# AI Context Export
Create a focused, portable snapshot of selected metrics for AI analysis.
[Open in Fuel Lens ↗](/?view=ai-context-export)
Select the nutrients, biometrics, and date range that matter to your question. Fuel Lens creates a downloadable context file containing the selected data and relevant summaries.
## What is exported?
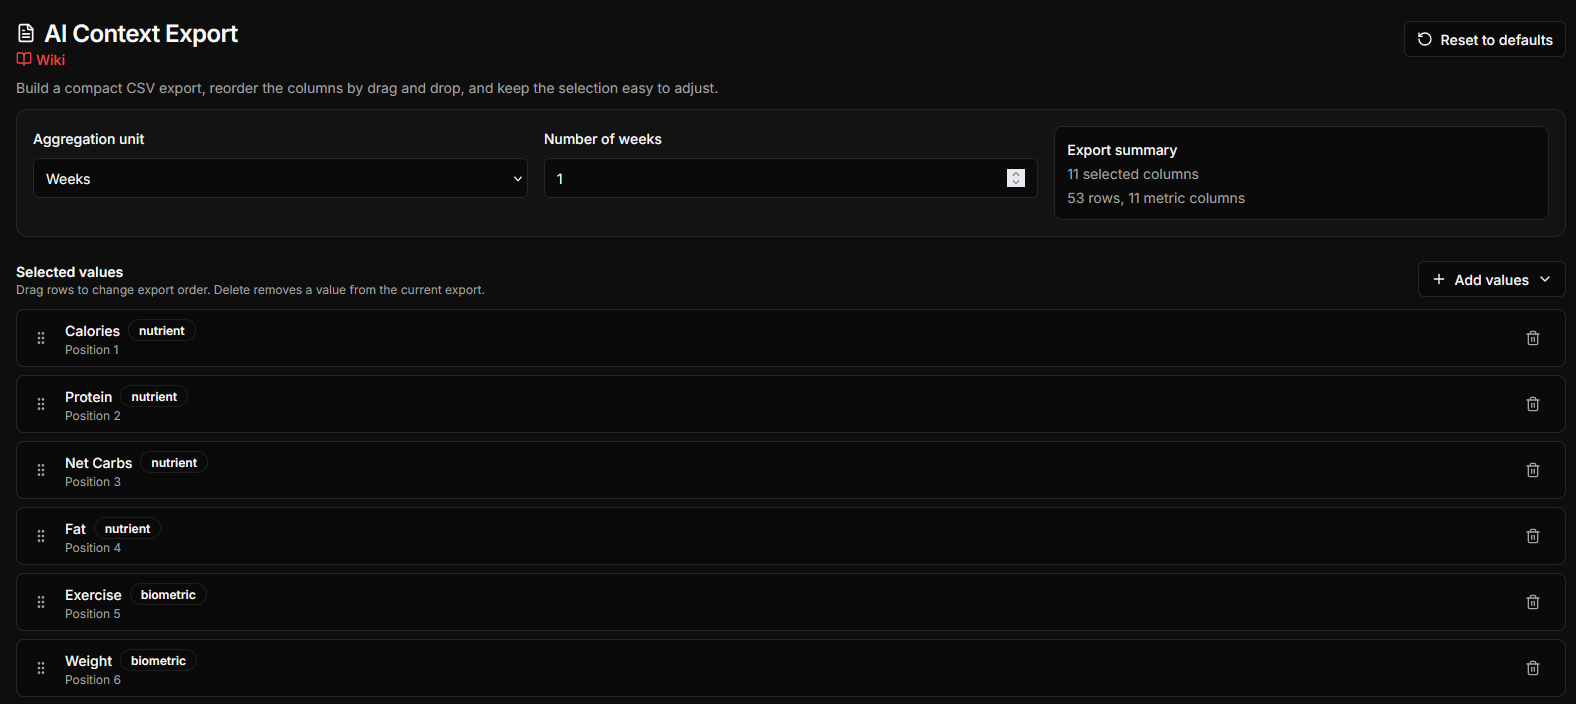
The export is a compact CSV table. The first column contains either individual dates or the start and end date of each aggregation window. The remaining columns contain the selected metrics.
The default selection includes:
- Calories, Protein, Net Carbs, and Fat
- Exercise calories, Weight, Body Fat, Sleep Score, Sleep Duration, RHR, and HRV
Additional nutrients and biometric series found in the imported data can be added from the metric picker. Units are included in the column headers where available, for example `Calories (kcal)`.
The metric picker also includes **Foods**. Add it to export one column with the foods consumed in each aggregation window, grouped by meal. Each meal entry includes summed calories, protein, carbohydrates, and fat, followed by the foods and their total logged amounts. Foods without a numeric gram amount use the imported portion text when available.
## Create an export
1. Open **AI Context Export** from the sidebar or use [Open in Fuel Lens ↗](/?view=ai-context-export).
2. Set the analysis range in the main app. The export follows the currently selected dates; if no dates are selected, it uses the available data range.
3. Choose **Days** or **Weeks**, then enter the number of days or weeks per row.
4. Choose a preset: **All**, **Body composition**, **Macros**, **Sleep and recovery**, or **Testosterone**. The last preset includes calories, fat, fat percentage, weight, body fat, and available nutrients commonly relevant to testosterone nutrition, such as zinc, magnesium, vitamin D, selenium, omega-3, vitamin B6, cholesterol, and saturated fat.
5. Add or remove metrics with the picker and drag the remaining rows into the order you want the AI to see. Enter a name and select **Save preset** to store your current selection in this browser. Saved presets can be applied or deleted later.
6. Check the CSV preview and select **Download CSV**.
Use **Reset to defaults** to restore the standard metric selection. The selected metrics, aggregation settings, and custom presets are saved locally in this browser, so they are available the next time you open the view.
## How aggregation works
For an aggregation window, Fuel Lens averages the available daily values for each selected metric. Missing values are left blank and are not treated as zero. Nutrients come from daily diary totals; Exercise is represented as exercise calories, while biometrics use their recorded daily values. The optional **Foods** column lists foods across the whole window and sums their logged amounts and macro nutrients; these totals are not daily averages.
If the selected range contains no value for any selected metric, that row is omitted. This keeps the file compact, but it also means the number of exported rows can be smaller than the number of calendar days in the range.
## Use it with an AI assistant
Upload the CSV only after reviewing it. Pair it with a focused question, for example:
> Compare my average calorie intake, body-weight trend, and exercise across the exported weeks. Point out patterns, unusual weeks, and data gaps.
Other useful questions include:
- Which selected nutrients changed most between the first and last aggregation window?
- Are weight changes temporally associated with changes in average calorie intake?
- Which weeks have missing sleep or biometric data, and how could that affect the comparison?
Treat AI output as exploratory analysis. It can identify patterns in the table, but it cannot establish causation or replace medical advice.
## Features
- Search and select metrics
- Choose standard metrics quickly
- Control the analysis date range
- Reorder columns for a clearer analysis prompt
- Preview the generated rows before downloading
- Download a compact CSV context
The export is created locally and only includes the metrics you choose. Fuel Lens does not need to upload the file to create it. Review the downloaded content before sharing it with an external AI service, especially when it contains dates, body measurements, sleep data, or other personal information.
## Settings Overview
Canonical URL: https://fuellens.vercel.app/wiki/settings
[← Back to Wiki](/wiki)
**SETTINGS**
# Settings Overview
The website settings page is the central place for target, calculation, display, source, and scoring preferences. Open it from the website navigation or visit `/settings`.
[Open Settings ↗](/settings)
## Settings pages
- [Goals](/wiki/settings-goals) controls nutrient targets, micronutrient presets, and ratio goals.
- [Energy & Macros](/wiki/settings-energy-macros) controls BMR, activity, carbohydrate basis, macro calculation mode, and keto options.
- [Display](/wiki/settings-display) controls meal-group metrics, intake priority, and target-band margins.
- [Scoring & Data](/wiki/settings-scoring-data) controls the primary data source, completed-day support, and nutrient-density scoring.
## How saving works
Settings are saved to the current browser. On the full settings page, select **Save settings** after making changes. The page also saves when it is left, so a reload can restore the last saved values.
Some display and chart preferences are stored separately from the main goal settings. If you change a setting while a dashboard view is open, return to that view or reload it when a component needs to refresh its derived values.
## Before changing settings
Import or restore your data first when you want to configure meal-group metrics or source-dependent nutrients. Keep a backup before clearing or replacing browser data; see [Data Management & Privacy](/wiki/data-management).
## Goal Overview
Canonical URL: https://fuellens.vercel.app/wiki/goals
[← Back to Wiki](/wiki)
# Goal Overview
The **Goal Overview** page shows how consistently you meet your configured
nutrient and ratio goals over the selected period.
[Open Goal Overview ↗](/?view=goals)
## What the page shows
### Overall Achievement
The achievement ring shows the percentage of goal checks that were met in the
active period. The page also summarizes the result as:
- **Met … Goals per day**: the average number of met goals compared with the
average number of available goals per day.
- **Met … Goals total**: all met goal checks compared with all available goal
checks in the period.
Only visible goals with usable source data are evaluated. Missing source data
is not treated as zero.
### Daily Achievement Trend
The line chart shows the percentage of goals met on each day. Use
**Aggregation** to view the daily values or average them into weeks, four-week
periods, quarters, semesters, or years. The chart follows the same date range
and day filter as the other dashboard views.
### Goal Rankings
The two ranking tables compare the visible goals by achievement rate in the
selected period.
#### Top Met Goals
This table ranks the visible goals with the highest achievement rate in the
selected period. Each row shows the percentage of days on which the goal was
met and the corresponding number of days.
#### Top Missed Goals
This table ranks the visible goals with the lowest achievement rate. Goals met
on every evaluated day are omitted from this list, so it highlights goals that
may need attention.
## How a goal is evaluated
- A value below **Min** is below target.
- A value above **Max** is above target.
- A value between **Min** and **Max** is in range.
- If only one limit is configured, only that side is evaluated.
The exact visible goals and their target values are configured in
[Settings → Goals](/settings). The Goal Overview page is for reviewing
progress; changing targets or ratio definitions is done in Settings.
## Energy & Macros
Canonical URL: https://fuellens.vercel.app/wiki/settings-energy-macros
[← Back to Wiki](/wiki)
**SETTINGS**
# Energy & Macros
Use **Settings → Energy & Macros** to define how Fuel Lens calculates your daily energy and macronutrient targets. This page documents the complete energy and macro calculation settings.
[Open Settings ↗](/settings)
## Energy target
Fuel Lens derives the daily energy target from **BMR** and **Baseline Activity Level**. Enter or review your basal metabolic rate, then choose the activity level that represents your usual non-exercise movement. **Custom** lets you provide an activity amount directly in kcal.
- **Basal Metabolic Rate (BMR)** is the estimated energy your body uses at complete rest, in kcal per day.
- **Baseline Activity Level** applies an activity multiplier to BMR and represents usual non-exercise movement.
- **Calculated Energy Target** is the resulting daily target used by the dashboard and percentage-based macro calculations.
The calculated target is used by the dashboard and by percentage-based macro calculations. On days with tracker activity, the target can be different from the baseline value shown in the settings because the recorded activity is used for that date. It is an estimate for analysis, not a medical prescription.
## Baseline activity and tracker activity
The **Baseline Activity Level** represents usual non-exercise movement. Tracker activity represents recorded activity calories for a specific day, such as Garmin or Cronometer exercise data.
With the default **Tracker activity can replace this baseline for that day** setting enabled, Fuel Lens uses:
```text
No tracker activity:
daily target = BMR + baseline activity + additional calories
Tracker activity present:
daily target = BMR + tracker activity + additional calories
```
This prevents the same activity from being counted twice. The setting is enabled by default and can be disabled when baseline and tracker activity should be added together.
For example, in a case where BMR is 1870 kcal and tracker activity is 1265 kcal, the daily target is:
```text
1870 + 1265 = 3135 kcal
```
If the macro ratios are 25% protein, 45% carbohydrates, and 30% fat, the resulting targets are approximately 196 g protein, 353 g carbohydrates, and 105 g fat.
The earlier inconsistent result came from using 4070 kcal for the macro ratios while the dashboard displayed 3135 kcal as the day’s target. That produced 254 g protein, 458 g carbohydrates, and 136 g fat because those values are the 25/45/30 split of 4070 kcal. The difference was the configured baseline activity amount being retained in the macro calculation after tracker activity had already been recorded.
## Track carbs as
Choose **Total Carbs** or **Net Carbs**. Net carbs generally subtract fiber and sugar alcohols. Use the option that matches the data source and the way you plan your diet.
## Macro calculation modes
| Mode | What it does |
| --- | --- |
| **Ratios** | Sets Protein, Carbs, and Fat as percentages of the energy target. The percentages should total 100%; gram targets change when the energy target changes. |
| **Fixed Targets** | Sets explicit daily gram targets. They remain fixed when the energy target or exercise changes; Fuel Lens warns when their calories do not closely match the energy target. |
| **Keto Calculator** | Derives protein from lean body mass, applies a net-carb limit, and assigns the remaining energy to fat. |
### Keto Calculator
- **Current Weight** is read from imported biometrics when available.
- **Body Fat %** is used with Current Weight to estimate lean body mass (LBM).
- **Protein (g per kg LBM)** multiplies LBM to calculate the protein target.
- **Net Carbs Limit** sets the upper carbohydrate target using the selected **Net Carbs** basis.
- **Fat (Remainder)** receives the remaining energy after protein and carbohydrates.
- **Keto Program** offers built-in presets or **Custom** values.
- **Athletic Bonus** adds 1 g of carbohydrates per 50 kcal of exercise to the keto carbohydrate target.
- Editing calculated protein or carbohydrate values switches the program to **Custom**.
Built-in keto presets:
| Program | Net carbs | Protein |
| --- | ---: | ---: |
| **Rigorous** | 20 g/day | 1.0 g/kg LBM |
| **Moderate** | 40 g/day | 1.5 g/kg LBM |
| **Relaxed** | 50 g/day | 2.5 g/kg LBM |
The calculator is a planning aid. It does not replace an individually appropriate nutrition recommendation.
## Saving changes
Review the values across the nested tabs, including the tracker activity override, then use **Save settings** at the top of the settings page. The settings are stored in this browser and are used by the dashboard, trends, diary, and goal views.
## Scientific context
The macro targets on this page are configurable planning values. A percentage split or the **Keto Calculator** output is not, by itself, evidence that a particular diet is suitable for an individual. For context, EFSA publishes population-level reference intake ranges for energy-yielding macronutrients; those ranges are different from a personalized prescription.
- [EFSA: Dietary reference values](https://www.efsa.europa.eu/en/topics/topic/dietary-reference-values) explains reference intake ranges for macronutrients and how reference values are used.
## Goals
Canonical URL: https://fuellens.vercel.app/wiki/settings-goals
[← Back to Settings Overview](/wiki/settings)
# Goals
The **Goals** tab controls the nutrient targets and ratio goals used throughout
FuelLens. Each micronutrient can have a minimum target, a maximum target, or
both. Applying a preset changes target values; it does not change which
nutrients are visible.
[Open Goals in Settings ↗](/settings)
## Micronutrient goal presets
The preset dropdown is shared with the **American DRI** and **DGE
recommendations** reference presets. **DEV's Settings** is a personal preset
created for Florian. It reflects the targets he considers personally suitable
after internet and AI research for a 21-year-old, 73 kg male 800 m runner. The
targets are intentionally higher than a reference value for selected
micronutrients where that personal context seemed relevant.
This is a personal nutrition preference, not an official recommendation or
medical prescription. It should not be interpreted as a guarantee that higher
intake is needed, and individual requirements can differ. The maximum values
are the upper limits used in this FuelLens preset where one was configured.
### DEV's Settings values
The following values are transcribed from the supplied Cronometer screenshots.
An em dash means that no maximum was configured in the preset.
| Nutrient | Daily target | Maximum | Unit |
| --- | ---: | ---: | --- |
| B1 (Thiamine) | 1.6 | — | mg |
| B2 (Riboflavin) | 1.8 | — | mg |
| B3 (Niacin) | 20 | 35 | mg |
| B5 (Pantothenic Acid) | 7 | — | mg |
| B6 (Pyridoxine) | 2 | 100 | mg |
| B12 (Cobalamin) | 5 | — | µg |
| Biotin | 30 | — | µg |
| Choline | 600 | 3500 | mg |
| Folate | 450 | 1500 | µg |
| Vitamin A | 1000 | — | µg |
| Beta-carotene | 4000 | — | µg |
| Lycopene | 7000 | 36000 | µg |
| Retinol | 300 | 3000 | µg |
| Vitamin C | 200 | 2000 | mg |
| Vitamin D | 1000 | 4000 | IU |
| Vitamin E | 18 | 100 | mg |
| Vitamin K | 120 | — | µg |
| Calcium | 1000 | 2500 | mg |
| Chromium | 35 | — | µg |
| Copper | 1.5 | 10 | mg |
| Fluoride | 4000 | 10000 | µg |
| Iodine | 150 | 1100 | µg |
| Iron | 18 | 45 | mg |
| Magnesium | 600 | 1200 | mg |
| Manganese | 3 | 11 | mg |
| Molybdenum | 45 | 2000 | µg |
| Phosphorus | 1000 | 4000 | mg |
| Potassium | 4000 | — | mg |
| Selenium | 80 | 400 | µg |
| Sodium | 2000 | 6000 | mg |
| Zinc | 16 | 25 | mg |
### General targets
| Nutrient | Daily target | Maximum | Unit |
| --- | ---: | ---: | --- |
| Alcohol | 0 | 3 | g |
| Phytate | — | 100 | mg |
### Lipid targets
| Nutrient | Daily target | Maximum | Unit |
| --- | ---: | ---: | --- |
| Monounsaturated Fat | 27 | — | g |
| Polyunsaturated Fat | 19 | — | g |
| Omega-3 | 3 | — | g |
| ALA | 2 | — | g |
| DHA | 0.3 | — | g |
| EPA | 0.1 | — | g |
| Omega-6 | 9 | 20 | g |
| AA | 0 | 0.5 | g |
| LA | 9 | 20 | g |
| Saturated Fat | 0 | 2 | g |
| Trans Fat | — | 600 | mg |
### Fibre and sugar targets
| Nutrient | Daily target | Maximum | Unit |
| --- | ---: | ---: | --- |
| Fiber | 45 | — | g |
| Insoluble Fiber | 30 | — | g |
| Soluble Fiber | 12 | — | g |
| Added Sugars | 0 | 75 | g |
| Sugar Alcohol | 0 | 20 | g |
For the Cronometer data source, **Sugar Alcohol** is part of the default
visible nutrient set. Applying **DEV's Settings** also marks it visible so the
goal is available immediately.
### Protein amino-acid targets
| Nutrient | Daily target | Maximum | Unit |
| --- | ---: | ---: | --- |
| Cystine | 1 | — | g |
| Glycine | 5 | — | g |
| Histidine | 1 | — | g |
| Isoleucine | 6 | — | g |
| Leucine | 10 | — | g |
| Lysine | 3.2 | — | g |
| Phenylalanine | 2.1 | — | g |
| Threonine | 1.8 | — | g |
| Tryptophan | 0.6 | — | g |
| Tyrosine | 4 | — | g |
| Valine | 7 | — | g |
Nutrients with no Daily Target in the screenshots are not included as active
targets in this preset. Existing visibility settings remain unchanged except
for Sugar Alcohol, which is intentionally made visible by this preset.
## Applying a preset
1. Open **Settings** and select **Goals**.
2. Choose a preset from **Micronutrient goal presets**.
3. Select **Apply Preset**.
4. Save the settings when using the full Settings page.
Preset application updates the target values of matching nutrients while
leaving macro and ratio settings untouched.
## Reference values and interpretation
Nutrient reference values are population references, and the value and its meaning depend on the nutrient, age group, sex, life stage, and the method used to derive it. They are useful context for setting goals, but a preset or logged intake does not diagnose deficiency or establish an individual's clinical requirement. The **DEV's Settings** preset is personal and should not be read as a research-backed athlete prescription.
- [EFSA: Dietary reference values](https://www.efsa.europa.eu/en/topics/topic/dietary-reference-values) explains the different reference-value types and their intended use.
- [DGE/ÖGE: Reference values for nutrient intake](https://www.dge.de/wissenschaft/referenzwerte/) provides the German-language reference-value overview and its supporting publications.
- [US Dietary Reference Intakes](https://odphp.health.gov/our-work/nutrition-physical-activity/dietary-guidelines/dietary-reference-intakes) describes the US reference-value framework, including RDA, AI, and upper intake levels.
## Display
Canonical URL: https://fuellens.vercel.app/wiki/settings-display
[← Back to Wiki](/wiki)
**SETTINGS**
# Display
Use **Settings → Display** to choose what appears in meal-group summaries and how close intake must be to a target before it is shown as in range.
[Open Settings ↗](/settings)
## Meal group display
Select **All meal groups (default)** to choose the nutrients, ratios, and scores shown in the Daily Diary. This setting is always available, including before importing food data, and also applies to future imports.
To customize one meal group, select its name and choose its metrics. Individual overrides take priority over the default. Choose **Use default display for this group** to remove an override. Meal group names load separately from saved data, so you can edit the default while that list is loading.
## Target band margin
Target bands are the green acceptable ranges around Energy, Protein, Carbs, and Fat in progress views. They change the visualization tolerance, not the target itself.
- **Margin** sets one symmetric percentage below and above the target. The default is ±5%.
- **Asymmetric Margins** allows different lower and upper tolerances, for example −5% and +10%.
- **Per-Nutrient Margins** allows individual tolerances for each classic macro. A macro without an override inherits the global setting.
- **Reset Margins to Default (5%)** removes custom margin settings.
Use a wider margin when small measurement differences should not dominate the visual status. Use a narrower margin when precise target adherence is important.
## Intake priority
Choose which imported representation is preferred for overall intake calculations:
- **Daily Summary** prefers the source's daily totals.
- **Servings** prefers the individual food-serving records.
This setting affects which values are used when both representations are available; it does not change the source files.
## Scoring & Data
Canonical URL: https://fuellens.vercel.app/wiki/settings-scoring-data
[← Back to Wiki](/wiki)
**SETTINGS**
# Scoring & Data
Use **Settings → Scoring & Data** to select the active nutrition profile and configure nutrient-density scoring.
[Open Settings ↗](/settings)
## Primary data source
Choose the profile that supplies the main nutrient and intake values: **Cronometer**, **FatSecret**, **MyFitnessPal**, or **Custom**. Source capabilities determine which nutrients and completed-day information are available. When a selected nutrient is not supported by the current source, enabling it can switch the profile to **Custom**.
## Completed days
**Support for completed days** enables the completed-day filter when the selected source provides that concept. It does not create completion information that is absent from imported data.
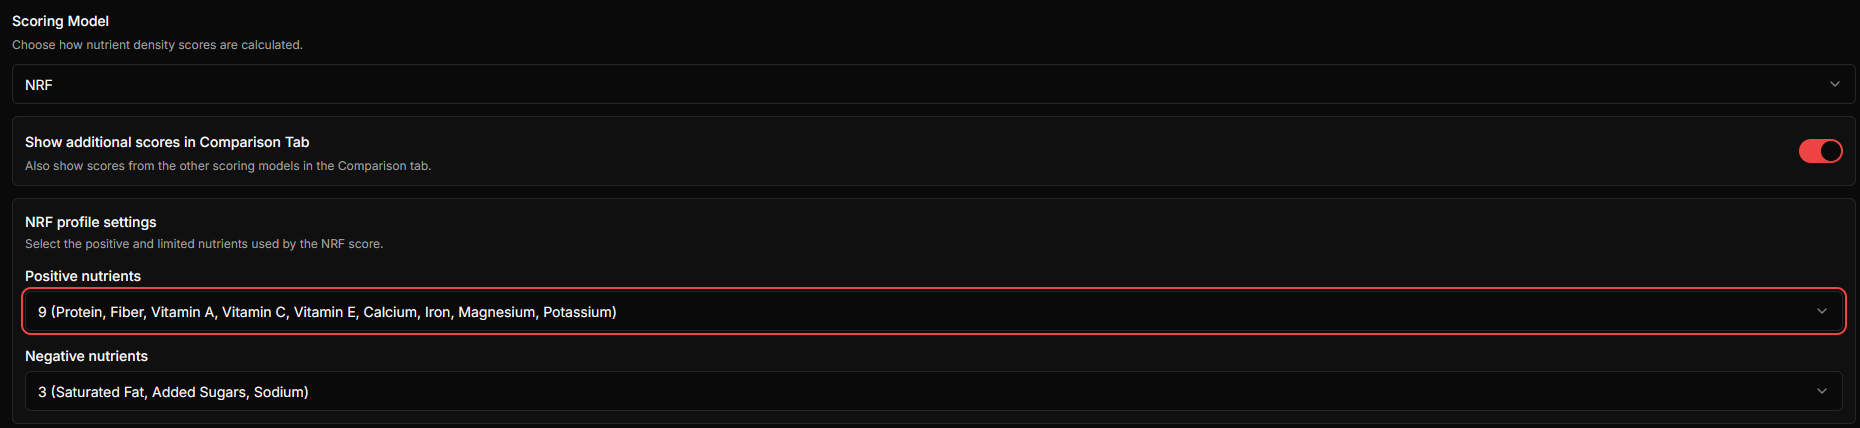
## Scoring model
Scoring model settings determine how foods and overall nutrition are evaluated; see [Nutrient Scoring Models](/wiki/nutrient-scoring-models) for more information.
Enable **Show additional scores in Comparison Tab** to display results from other available models next to the active model.
## NRF profiles
Choose a positive NRF profile (9, 15, 21, or 26 nutrients) and a negative profile (2, 3, 4, or 5 limited nutrients); see [Nutrient Scoring Models](/wiki/nutrient-scoring-models) for the nutrient lists and scoring details.
## Data and privacy
These settings affect how the existing browser data is interpreted; they do not modify the imported source files. For backup, migration, and deletion guidance, see [Data Management & Privacy](/wiki/data-management).
## Adaptive TDEE
Canonical URL: https://fuellens.vercel.app/wiki/adaptive-tdee
[← Back to Wiki](/wiki)
**ENERGY ANALYSIS**
# Adaptive TDEE
Estimate your **Total Daily Energy Expenditure (TDEE)** from the relationship between logged energy intake and observed body-weight change.
[Open Adaptive TDEE in Fuel Lens ↗](/?view=tdee)
## What TDEE means
TDEE is the estimated number of kilocalories your body uses per day. It includes resting metabolism, normal daily movement, digestion, and exercise when the selected model or dashboard configuration includes it.
The central energy-balance idea is:
`Energy stored = Energy eaten − Energy expended`
Rearranged for expenditure:
`TDEE ≈ average intake − energy equivalent of observed weight change`
A stable weight at 2,800 kcal/day suggests a TDEE near 2,800 kcal/day. Losing weight while eating 2,800 kcal/day suggests that TDEE is higher than 2,800; gaining weight suggests that it is lower.
Adaptive TDEE is an estimate, not a laboratory measurement. Water, glycogen, food in the digestive system, sodium, menstrual-cycle changes, illness, and logging errors can temporarily move scale weight without representing an equivalent change in stored tissue.
## Which model is used?
Fuel Lens supports two models. The default is **First Principles TDEE**.
| Model | How it works | Best use |
|---|---|---|
| First Principles TDEE | Estimates expenditure directly from intake and the smoothed weight trend in overlapping rolling windows | The primary adaptive estimate when enough real observations exist |
| Statistical TDEE | Starts with a BMR-based prior and blends it toward the intake/weight estimate according to data coverage | A useful comparison or fallback when data is sparse |
Legacy names `dynamic`, `rolling-window`, and `hybrid` are normalized to First Principles TDEE.
## First Principles TDEE
### 1. Build the daily timeline
The calculator creates one daily timeline covering the first through last date found in energy, exercise, or weight data.
- Energy labels recognized by default: `Energy`, `Calories`, and `Calories (kcal)`.
- If several recognized labels exist on one day, the first matching label in the configured label order is used; values are not added together.
- Exercise calories are summed per day and are used for diagnostics and optional baseline calculations.
- Multiple weight entries on the same day are averaged.
- Missing weights between two observations are linearly interpolated.
- The interpolated series is smoothed with a 7-day moving average to reduce daily scale noise.
### 2. Estimate each rolling window
The default rolling window is 21 days, moving forward in 7-day steps. At least 14 timeline days are needed before First Principles can run.
For each window, the calculator requires:
- at least `max(2 × minimum calorie days, 50% of the window)` intake days;
- at least `max(minimum weight entries + 2, 20% of the window)` observed weight days; and
- the same minimum number of smoothed weight points.
The default minimums are 4 calorie days and 2 weight entries. A window that does not meet them is rejected.
The smoothed weights are fitted with a least-squares linear regression. If `wᵢ` is smoothed weight on timeline day `i`, the slope is:
`weight slope = Σ(i − mean(i))(wᵢ − mean(w)) / Σ(i − mean(i))²`
The slope is measured in kg/day. A negative slope means weight is falling.
### 3. Convert weight change into energy
The model uses an effective energy density rather than assuming that every kilogram is pure fat.
Constants used by the implementation:
`fat energy density = 9,300 kcal/kg`
`lean-tissue energy density = 1,100 kcal/kg`
If body-fat percentage is available, the estimated fat share is:
`fat share = clamp(0.55 + 0.40 × body-fat fraction, 0.55, 0.85)`
Without body-fat data, the default fat share is `0.66`. The baseline energy density is:
`baseline density = fat share × 9,300 + (1 − fat share) × 1,100`
Rapid weight changes receive a penalty because they are more likely to include water and glycogen shifts:
`weekly change = |weight slope| × 7`
`rapid-shift factor = clamp(1 − 0.08 × weekly change, 0.75, 1.00)`
`effective density = round(baseline density × rapid-shift factor)`
### 4. Calculate each window's TDEE
For a window with average daily intake `I`, weight slope `S` in kg/day, and effective density `D` in kcal/kg:
`window TDEE = I − D × S`
This has the expected direction:
- If weight is stable, `S ≈ 0`, so TDEE is close to intake.
- If weight is falling, `S < 0`, so the subtraction adds calories to intake.
- If weight is rising, `S > 0`, so the estimate is below intake.
Example using the simple 7,700 kcal/kg approximation:
`intake = 2,400 kcal/day`
`weight change = −1.0 kg over 21 days = −0.0476 kg/day`
`TDEE ≈ 2,400 − 7,700 × (−0.0476) ≈ 2,767 kcal/day`
The production calculation may use a different effective density based on body composition and rate of change.
### 5. Combine windows robustly
All valid window estimates are collected. If there are at least six estimates, the lowest and highest 15% are trimmed. The final First Principles TDEE is the median of the remaining estimates:
`final TDEE = median(robust window estimates)`
The trend slope shown in diagnostics is the regression trend across the window estimates, expressed in kcal per window. The estimate is rounded to whole kcal/day.
## Statistical TDEE
Statistical TDEE is a BMR-based prior that adapts toward observed energy balance.
### 1. Calculate the BMR prior
The calculator chooses the first available option in this order.
#### Katch–McArdle
Used when weight and body-fat percentage are available:
`lean mass = weight × (1 − body-fat percentage / 100)`
`BMR = 370 + 21.6 × lean mass`
Weight is in kg and lean mass is in kg.
#### Mifflin–St Jeor
Used when weight, height, age, and sex are available:
`BMR = 10 × weight + 6.25 × height − 5 × age + s`
Height is in cm. The sex constant is:
| Sex value | `s` |
|---|---:|
| Male | `+5` |
| Female | `−161` |
The implementation treats a value beginning with `m` as male and other available values as female for this formula.
#### Configured fallback BMR
If neither formula can be calculated, the configured `fallbackBmr` is used. If no valid BMR source exists, Statistical TDEE returns no result.
### 2. Apply activity assumptions
The prior TDEE is:
`prior TDEE = BMR × activity factor`
Supported activity levels map to these factors:
| Activity level | Factor |
|---|---:|
| No activity | `1.00` |
| Sedentary | `1.20` |
| Lightly active | `1.375` |
| Moderately active | `1.50` |
| Very active | `1.90` |
| Custom | `1 + custom activity kcal / BMR` |
If no activity level or custom factor is supplied, the default factor is `1.20`.
Exercise calories are **not added by default**. When `countExerciseAdditively` is enabled, average exercise calories are added to the fallback prior. The UI also reports exercise separately so that baseline expenditure can be shown without double-counting it.
### 3. Calculate the observed TDEE
When there is enough intake and weight data, Statistical TDEE uses the same smoothed regression and effective-density calculation as First Principles:
`observed TDEE = average intake − effective density × weight slope`
Evidence is based on calorie and weight coverage:
`calorie coverage = clamp(calorie days / timeline days, 0, 1)`
`weight coverage = clamp(weight points / (timeline days / 3), 0, 1)`
`evidence score = clamp(0.65 × calorie coverage + 0.35 × weight coverage, 0, 1)`
The blend weight is:
`blend weight = clamp(0.15 + 0.70 × evidence score, 0.15, 0.85)`
### 4. Blend and converge
Starting from the prior, the model moves toward the observed estimate:
`next TDEE = current TDEE + (observed TDEE − current TDEE) × blend weight`
The result is rounded after each iteration. Iteration stops when the change is at most 1 kcal/day or after 16 iterations:
`statistical TDEE = converged current TDEE`
With sparse data, the model skips the observed estimate and returns the activity-adjusted prior. Diagnostics identify this as a fallback.
## Exercise and baseline values
The primary TDEE estimate is based on gross logged intake and observed weight change. Exercise is not subtracted from the First Principles formula.
The UI separately reports:
`average net intake = average intake − average exercise calories`
`non-exercise TDEE = TDEE − average exercise calories`
These are interpretation values. Do not subtract exercise from intake and then subtract it again from TDEE; that would count the same activity twice.
## Defaults, limits, and fallback behavior
| Setting | Default |
|---|---:|
| Model | First Principles |
| Minimum timeline | 14 days |
| Rolling window | 21 days |
| Window step | 7 days |
| Minimum calorie days | 4 |
| Minimum weight entries | 2 |
| Accepted TDEE range | 500–10,000 kcal/day |
| Statistical activity factor | 1.20 |
| Add exercise to Statistical fallback | No |
The calculator falls back to Statistical TDEE when First Principles has fewer than 14 days, has no valid rolling windows, or produces a value outside the accepted range. Statistical TDEE can also fall back to its BMR/activity prior when intake or weight evidence is insufficient, invalid, or outside the accepted range.
## Understanding the result
- **Total Energy Expenditure:** the estimated daily energy use.
- **Baseline Metabolic Rate:** the BMR-based or non-exercise baseline shown by the selected view; it is not the same thing as TDEE.
- **Average Intake:** average daily energy from the selected recognized energy label.
- **Average Net Intake:** average intake minus logged exercise calories.
- **Weight Change:** observed change and its regression-derived rate.
- **Activity Factor:** the effective TDEE/BMR ratio in the statistical model.
- **Confidence:** a qualitative signal based on calorie coverage, weight coverage, and the number of valid windows.
- **Current Target:** the active dashboard calorie target. It is a planning value, not necessarily the adaptive estimate.
- **Calorie Gap:**
`calorie gap = average intake − TDEE`
A positive gap indicates intake above the estimate; a negative gap indicates intake below it.
## How to get a better estimate
- Log intake consistently, including weekends and meals away from home.
- Record weight under similar conditions and use several observations per week when possible.
- Keep the selected date range long enough to include multiple rolling windows.
- Avoid interpreting a single day's result; use the estimate and its trend over time.
- Treat sudden changes after high-sodium meals, travel, illness, or unusual training as potentially transient.
- Check the displayed confidence, calorie coverage, weight coverage, and whether a fallback was used.
Adaptive TDEE becomes more useful as consistent intake and weight observations accumulate. It should support decisions about calorie targets, not replace medical or clinical assessment.
## Scientific background
The intake-and-weight-change approach follows energy-balance accounting, but human weight change is dynamic: energy expenditure and body composition can adapt over time. Hall and colleagues describe why static calorie-to-weight rules do not predict the time course reliably. A Fuel Lens estimate is a practical estimate from logged data, not a laboratory measurement or a reproduction of their full physiological model. Self-reported intake and short-term body-weight changes also carry measurement error.
- Hall KD et al. (2011). [Quantification of the effect of energy imbalance on bodyweight](https://doi.org/10.1016/S0140-6736(11)60812-X). *The Lancet*, 378(9793), 826–837.
- Racette SB et al. (2007). [Validation study of energy expenditure and intake during calorie restriction using doubly labeled water and changes in body composition](https://pmc.ncbi.nlm.nih.gov/articles/PMC2662402/). *The American Journal of Clinical Nutrition*, 85(1), 73–79.
## Data Management & Privacy
Canonical URL: https://fuellens.vercel.app/wiki/data-management
[← Back to Wiki](/wiki)
**REFERENCE**
# Data Management & Privacy
Save, restore, export, and clear the data kept in your browser.
[Open in Fuel Lens ↗](/)
Fuel Lens can save the current dataset and settings in browser storage. Storage is local to the browser profile and device.
## Available actions
- Save data to browser
- Load a saved snapshot
- Export a full backup
- Import data, settings, or a full backup
- Clear data and settings
## Storage and migration
Fuel Lens keeps the large serving history in IndexedDB and the smaller
dashboard state in a separate persisted store. The dashboard can hydrate core
values first while Foods and serving details load in the background; the
complete serving history is still retained.
Older browser snapshots are migrated through visible **Reading data**,
**Converting**, **Validating**, and **Ready** phases. Do not close the tab
during migration. If migration fails, use the offered backup download before
retrying.
## Backups
Use Export before clearing browser data or moving to another device. Importing a snapshot replaces the corresponding current data, so confirm the overwrite prompt carefully.
## Privacy boundary
Production analysis is client-side. Treat exported backup and AI-context files as sensitive because they contain the data you selected.
## Google Drive Sync
Canonical URL: https://fuellens.vercel.app/wiki/google-drive-sync
[← Back to Wiki](/wiki)
**DATA MANAGEMENT**
# Google Drive Sync
Google Drive Sync V2 keeps a selected FuelLens workspace current across devices. FuelLens reads and writes the workspace from your browser; there is no FuelLens sync server.
[Open FuelLens](/)
## What syncs
The workspace contains serving records, daily nutrient summaries, biometrics, exercises, and selected profile settings such as goals and macros. Device-specific display and date-filter preferences stay on that device. Existing history is retained; changes are tracked record by record, including deletions.
Drive stores one compressed `.flsync.gz` workspace file. FuelLens checks its SHA-256 checksum when reading the file, so incomplete or damaged data is rejected instead of being applied.
## Connect or create a workspace
Open **Settings → Google Drive Sync** and sign in when prompted.
- **Create a workspace:** enter a name and choose a Google Drive folder in the Google Picker. FuelLens uploads the current data to a new workspace file in that folder.
- **Connect to a workspace:** choose an existing FuelLens workspace file. FuelLens downloads it and applies its data to the current browser.
Choose the same workspace file on each device that should share data. The account needs edit access to upload changes. A workspace in a shared folder can be selected by another Google account when it has the required Drive access.
If the browser already contains data, export a backup before connecting to a workspace you have not used on this device. Connecting applies the workspace to the browser; it does not combine unrelated datasets automatically.
## Automatic and manual sync
After a workspace is connected, saved FuelLens data changes are queued for background sync. Small bursts are grouped; syncing normally starts after about 15 seconds and may wait longer while more changes keep arriving. Reconnecting to the internet triggers a sync. A valid cached Google access token lets background sync run without opening a sign-in popup.
Use **Sync now** in the sync dialog to start a manual sync. If Google sign-in is needed again, FuelLens pauses background syncing and asks you to sign in before continuing. Sync status and errors appear in the dialog.
When the remote workspace has not changed, FuelLens checks its Drive version and skips downloading the full workspace. When another device has updated it, FuelLens downloads the latest version and merges record-level changes.
## Conflicts
If the same record was changed differently on this device and in Drive, FuelLens pauses before uploading. It shows the conflicting record and asks which value to keep. For supported records, you can choose local or Drive values for individual fields; choose a value for every conflict to continue.
Until the choices are complete, neither side is overwritten. After you resolve the conflicts, FuelLens applies the merged data locally and uploads the resolved workspace.
## Restore points and backups
FuelLens keeps a Drive revision before the first upload of a day and when you explicitly request a restore point. Up to 10 restore points are retained; older points are pruned when Drive permits it. Restore points are safety copies, not a substitute for a separate backup.
You can also download a full JSON backup from the sync dialog. Keep a copy somewhere safe before switching workspaces or making a large data change.
## Privacy and access
FuelLens requests Google's narrow `drive.file` permission. The app works with the workspace files you select or create through Google Picker; it does not scan all Drive files. Workspace data is stored in your Google Drive and local browser storage, and is transferred directly between your browser and Google Drive using your Google sign-in.
Disconnecting removes this browser's FuelLens sync configuration and cached access token. It does not delete the workspace or other backup files from Google Drive. You can reconnect by selecting the workspace file again.
## Troubleshooting
- **Sign-in required:** reconnect your Google account in the sync dialog. Background sync stays paused until authentication succeeds.
- **No edit access:** ask the workspace owner to grant edit access, then retry.
- **Workspace changed elsewhere:** wait for the merge to finish or resolve the displayed conflicts.
- **Damaged or incomplete file:** retry the sync on a stable connection. FuelLens validates file size and checksum before applying downloaded workspace data.
- **Workspace not listed:** use the correct Google account and confirm that the account can access the selected Drive folder or shared drive.
## Related guides
- [Data Management & Privacy](/wiki/data-management)
- [Upload & data import](/wiki/upload)
- [Settings](/wiki/settings)
## Nutrient Scoring Models
Canonical URL: https://fuellens.vercel.app/wiki/nutrient-scoring-models
[← Back to Wiki](/wiki)
**NUTRITION ANALYSIS**
# Nutrient Scoring Models
Fuel Lens offers two approaches to nutrient-density scoring. Both compare foods per 100 kcal; interpret each score together with its data coverage.
## Nutrient Rich Food Index (NRF): the scientific standard
The **Nutrient Rich Food Index (NRF)** scores nutrients to encourage against nutrients to limit. The classic **NRF 9.3** combines nine positive nutrients—protein, fiber, vitamins A, C and E, calcium, iron, magnesium and potassium—with three nutrients to limit: saturated fat, added sugars and sodium. It measures nutrient density rather than calories alone. [Drewnowski (2010)](https://doi.org/10.3945/ajcn.2010.28450D) describes its use in identifying nutritious, affordable foods.
Research variants include **NRF 6.3, NRF 9.3, NRF 11.3 and NRF 15.3**: the numbers identify the positive and limited nutrient counts. Fuel Lens offers NRF 9.3 alongside adapted and expanded profiles up to NRF 26.5; its nutrient sets and normalized display are specific to the app.
[Read the Nutrient Rich Food Index (NRF) guide: variants, formula and research →](/wiki/nrf)
## Custom model: soft caps and incomplete data
The [**Custom model**](/wiki/custom-model) uses an exponential soft cap and reweights known nutrients when data is missing. Read its dedicated guide for the formula, nutrient weights, and reliability.
[Compare foods in Fuel Lens ↗](/foods/compare) · [Scoring settings](/wiki/settings-scoring-data)
## Nutrient Rich Food Index (NRF)
Canonical URL: https://fuellens.vercel.app/wiki/nrf
[← Nutrient Scoring Models](/wiki/nutrient-scoring-models)
**NUTRITION ANALYSIS**
# Nutrient Rich Food Index (NRF)
The **Nutrient Rich Food Index (NRF)** is a nutrient-profiling approach that balances nutrients to encourage against nutrients to limit. Also called the **Nutrient Rich Foods Index** in the original literature, it measures nutritional value relative to a reference amount of food or energy. Fuel Lens uses a per-100-kcal comparison, so foods with different calorie densities can be compared on the same energy basis.
## What is the Nutrient Rich Food Index 9.3?
The classic **Nutrient Rich Food Index 9.3 (NRF 9.3)** combines nine positive nutrients—protein, fiber, vitamins A, C and E, calcium, iron, magnesium and potassium—and subtracts contributions from saturated fat, added sugars and sodium. The notation is a nutrient count: **9 positive nutrients and 3 nutrients to limit**, rather than a software version.
[Drewnowski's 2010 article](https://doi.org/10.3945/ajcn.2010.28450D) describes food rankings based on daily-value contributions and discusses combining them with prices to assess affordability. A nutrient-density score alone does not measure price.
## Typical Nutrient Rich Food Index variants in research
The [2009 development and validation study by Fulgoni, Keast and Drewnowski](https://jn.nutrition.org/article/S0022-3166%2822%2906842-0/fulltext) compared variants including:
| Research variant | Positive nutrients | Nutrients to limit |
|---|---:|---|
| NRF 6.3 | 6 | Saturated fat, added sugars, sodium |
| NRF 9.3 | 9 | Saturated fat, added sugars, sodium |
| NRF 11.3 | 11 | Saturated fat, added sugars, sodium |
| NRF 15.3 | 15 | Saturated fat, added sugars, sodium |
The study compared scores with the Healthy Eating Index using US dietary survey data. NRF 9.3 was a strong-performing model; adding more nutrients did not automatically improve agreement with diet quality. Nutrient counts alone do not establish that two implementations use identical nutrient sets or reference values.
## Nutrient Rich Food Index profiles available in Fuel Lens
Fuel Lens implements the following profiles. The expanded profiles are app adaptations, and the cited studies do not validate all of them. In particular, Fuel Lens's cumulative 15-nutrient set differs from the research NRF 15.3 set.
| Model | Positive nutrients | Limited nutrients | Best use |
|---|---:|---:|---|
| NRF 26.5 | 26 | 5 | Broadest supported NRF variant |
| NRF 26.4 | 26 | 4 | Broad NRF variant without sodium |
| NRF 26.3 | 26 | 3 | Broad NRF variant |
| NRF 21.3 | 21 | 3 | Expanded Fuel Lens profile |
| NRF 15.3 | 15 | 3 | Broad micronutrient comparison |
| NRF 9.3 | 9 | 3 | Classic compact baseline |
| NRF 9.2 | 9 | 2 | Compact baseline without sodium |
## How Fuel Lens calculates the Nutrient Rich Food Index
Fuel Lens converts each nutrient amount to **per 100 kcal**, then compares it with one twentieth of that nutrient's daily reference amount for a 2,000-kcal diet:
**Nutrient points = min(100, 100 × amount per 100 kcal ÷ (daily reference ÷ 20))**
**Raw score = sum of positive nutrient points − sum of limited nutrient points**
**Displayed score = raw score ÷ number of positive nutrients**
For example, a nutrient supplying 5% of its daily reference per 100 kcal reaches Fuel Lens's 100-point cap for that nutrient. The app caps both positive and limited contributions. This energy-adjusted reference and display normalization are implementation choices; a Fuel Lens score should not be treated as numerically interchangeable with a published research score.
### Scale and normalization
Fuel Lens normalizes the Nutrient Rich Food Index to a maximum displayed score of 100%. This percentage describes the score scale, not the percentage of all daily nutritional needs met. Scores are not floored at 1, so limited-nutrient penalties can produce values below 0.
### Maximum NRF raw scores
The raw score is the positive nutrient total minus limited nutrient penalties, before normalization. Its maximum occurs when all positive contributions reach their caps and all penalties are zero:
**Maximum raw score = number of positive nutrients × 100**
The normalized score is calculated by dividing the raw score by the same number of positive nutrients. Limited nutrients do not affect this maximum when they contribute zero penalty. Therefore, changing the number of limited nutrients does not change the score ceiling.
| Number of positive nutrients | Maximum raw score |
|---:|---:|
| 9 | 900 |
| 15 | 1,500 |
| 21 | 2,100 |
| 26 | 2,600 |
The configurable `NRF` model uses the selected positive profile, so its maximum raw score is determined by the selected positive-nutrient count. For example, a 9-nutrient profile has a maximum raw score of 900, while a 26-nutrient profile has a maximum raw score of 2,600. After division by the positive-nutrient count, both normalize to a maximum displayed score of 100.
## Nutrient Rich Food Index nutrient sets in Fuel Lens
The NRF model combines a positive nutrient profile with a negative nutrient profile. The number before the dot is the number of positive nutrients; the number after the dot is the number of negative nutrients that can subtract points.
The positive and negative profiles are independent. The tables below show what each additional stage contributes.
### Positive nutrients
Positive nutrients reward nutrient density. The profiles are cumulative: each stage contains the previous stage and adds the nutrients in the last column.
| Positive stage | Previous stage | Newly added nutrients |
|---|---|---|
| **NRF 9** | — | Protein, Fiber, Vitamins A, C and E, Calcium, Iron, Magnesium, Potassium |
| **NRF 15** | NRF 9 | Vitamins D and K, Vitamin B6, Vitamin B12, Folate, Zinc |
| **NRF 21** | NRF 15 | Omega-3, Thiamine (Vitamin B1), Riboflavin (Vitamin B2), Niacin (Vitamin B3), Phosphorus, Selenium |
| **NRF 26** | NRF 21 | Monounsaturated Fat, Pantothenic Acid (Vitamin B5), Copper, Manganese, Choline |
A higher positive stage leaves the earlier nutrients unchanged. It adds more positive contributions to the average, but it also requires more complete food data for a reliable comparison.
### Negative nutrients
Negative nutrients are nutrients to limit. Their points are subtracted from the positive nutrient points. The profiles are cumulative along their stated path; NRF 4 starts again from NRF 2 and is not NRF 3 plus one nutrient.
| Negative stage | Previous stage | Newly added or changed nutrients |
|---|---|---|
| **NRF 2** | — | Saturated Fat, Added Sugars |
| **NRF 3** | NRF 2 | Sodium |
| **NRF 4** | NRF 2 | Trans Fat, Alcohol; Sodium is not included |
| **NRF 5** | NRF 4 | Sodium |
The suffix after the dot selects this negative profile: `.2` uses NRF 2, `.3` uses NRF 3, `.4` uses NRF 4, and `.5` uses NRF 5. Adding a negative nutrient adds another possible penalty; it does not increase the score ceiling.
## Data completeness and reliability
Every result includes `data_coverage_percent`. The denominator is the number of nutrients used by the selected model.
- Missing, `null`, or untracked Cronometer values are unavailable.
- A measured value of `0` is known and counts toward coverage.
- Lower coverage means the score is less reliable for comparison.
- Coverage is model-specific because each NRF variant uses a different nutrient set.
Always interpret a score together with its data coverage.
Missing nutrient amounts contribute zero points in Fuel Lens's Nutrient Rich Food Index calculation. Missing positive nutrients can lower the score; missing limited nutrients can hide penalties. The calculation does not reweight available nutrients as the [Custom model](/wiki/custom-model) does.
## Research applications and interpretation
The [2021 study by Imai and colleagues](https://pmc.ncbi.nlm.nih.gov/articles/PMC8400739/) applied an adapted Nutrient Rich Food Index 9.3 to dietary records from 108 pregnant women in Japan. It used Japanese references, vitamin D instead of vitamin E, and penalties for intake exceeding limiting references. Its maximum score was 900. This illustrates why reference values, selected nutrients, energy adjustment and penalty rules must be checked before comparing studies or apps.
Use Fuel Lens scores to compare foods under the same profile and data conditions. The cited research does not establish that Fuel Lens's expanded profiles predict health outcomes.
## Nutrient Rich Food Index references
- Drewnowski A. (2010). [The Nutrient Rich Foods Index helps to identify healthy, affordable foods](https://doi.org/10.3945/ajcn.2010.28450D). *The American Journal of Clinical Nutrition*, 91, 1095S–1101S.
- Fulgoni VL III, Keast DR, Drewnowski A. (2009). [Development and Validation of the Nutrient-Rich Foods Index: A Tool to Measure Nutritional Quality of Foods](https://jn.nutrition.org/article/S0022-3166%2822%2906842-0/fulltext). *The Journal of Nutrition*, 139, 1549–1554. [DOI: 10.3945/jn.108.101360](https://doi.org/10.3945/jn.108.101360).
- Imai C. et al. (2021). [Application of the Nutrient-Rich Food Index 9.3 and the Dietary Inflammatory Index for Assessing Maternal Dietary Quality in Japan: A Single-Center Birth Cohort Study](https://pmc.ncbi.nlm.nih.gov/articles/PMC8400739/). *Nutrients*, 13, 2854.
[Open nutrient scoring](/foods/compare)
[Read about the Custom model](/wiki/custom-model)
## Custom model
Canonical URL: https://fuellens.vercel.app/wiki/custom-model
[← Nutrient Scoring Models](/wiki/nutrient-scoring-models)
**NUTRITION ANALYSIS**
# Custom model
The Custom Exponential Model is designed for practical food comparison, athletic performance, and incomplete Cronometer entries. It uses a soft cap: additional intake continues to improve the result, but with diminishing returns.
## Custom Exponential Model
The model first converts every nutrient to an amount per 100 kcal. This makes a calorie-dense and a calorie-sparse food comparable. For each nutrient, it divides that amount by the nutrient's 2,000-kcal daily-value reference, then applies the soft cap:
**Value = 1 − e⁻ˣ**
Here, `x` is the amount per 100 kcal divided by the reference amount per 100 kcal. A nutrient at its reference gives about 63.2% of its possible contribution; more intake keeps helping but never adds more than 1. Positive nutrients are averaged, limited nutrients are averaged separately, and the final raw score is:
**Raw score = 50 + 50 × positive average − 50 × limited average**
The result is rounded to one decimal place and clamped to 1-100. Missing or non-numeric nutrient fields are left out of that group's average; the remaining known nutrients are reweighted to the full group. This is why incomplete data does not automatically reduce the score, while `data_coverage_percent` tells you how much evidence the result contains. The low-energy fallback returns 50 when energy is unavailable or below the safety threshold.
The custom model's full positive set is Protein, Fiber, Omega-3, Monounsaturated Fat, Vitamins A, C, D, E and K, Thiamine (Vitamin B1), Riboflavin (Vitamin B2), Niacin (Vitamin B3), Pantothenic Acid (Vitamin B5), Vitamin B6, Folate, Vitamin B12, Choline, Calcium, Copper, Iron, Magnesium, Manganese, Phosphorus, Potassium, Selenium, Iodine and Zinc. The nine essential amino acids are also positive, but each has half weight: Histidine, Isoleucine, Leucine, Lysine, Methionine, Phenylalanine, Threonine, Tryptophan and Valine. Limited nutrients are Added Sugars, Saturated Fat, Trans Fat, Alcohol, Cholesterol, Oxalate, Phytate and Sugar Alcohol.
## Data completeness and reliability
Every result includes `data_coverage_percent`. The denominator is the number of nutrients used by the selected model.
- Missing, `null`, or untracked Cronometer values are unavailable.
- A measured value of `0` is known and counts toward coverage.
- Lower coverage means the score is less reliable for comparison.
- Coverage is model-specific: the Custom model uses its own set of positive and limited nutrients.
Always interpret a score together with its data coverage.
[Open nutrient scoring](/foods/compare)
[Read about the Nutrient Rich Food Index (NRF)](/wiki/nrf)